
Workflow Automation ROI: What Return to Expect and When

Most well-scoped workflow automations pay back in months, not years. Across independent studies, three-year ROI for high-volume back-office use cases lands in a 150% to 300% range, with NiCE’s customer benchmarks showing a median around 220% and payback in 6 to 18 months depending on the process. Forrester’s Total Economic Impact analysis of a large composite organization found an even sharper number: 248% risk-adjusted ROI over three years, driven mostly by time savings and retired legacy tooling.
The processes that pay back fastest share three traits: they run often, follow clear rules, and currently eat hours from people earning a decent wage. Form routing and reminder chains often pay back within weeks. Onboarding and invoice workflows tend to land in 1 to 3 months.
One catch trips up almost every ROI pitch that later falls apart in front of finance: license cost alone is not the cost. Skip integration, training, and maintenance, and the ROI number you present will not survive a CFO’s second question.
Key Takeaways
Workflow automation ROI depends less on the software you pick than on measuring a real baseline, pricing total cost of ownership honestly, and tracking adoption alongside financial return.
| Point | Details |
|---|---|
| Typical ROI range | Three-year ROI for well-scoped automations commonly falls between 150% and 300%, with a median near 220%. |
| Payback windows vary by use case | Quick-win automations pay back in weeks; enterprise back-office projects often take 9 to 18 months. |
| Include full TCO, not just license cost | Integration alone often runs 30% to 50% over initial estimates, so budget accordingly before presenting ROI. |
| Change management is a multiplier | Low adoption can cut realized benefit by nearly half even when the automation itself works correctly. |
| EasyFlow reduces onboarding friction | Magic links let external collaborators complete tasks without creating accounts, cutting follow-ups and speeding execution. |
Table of Contents
- Why Workflow Automation ROI Matters More Than a Feature List
- How Do You Calculate Workflow Automation ROI?
- Which KPIs Actually Prove Automation Is Working?
- What ROI and Payback Should You Expect by Use Case?
- What Belongs in Your Automation Cost Model?
- How Do You Build an ROI Case Finance Will Approve?
- How Much Does Change Management Affect the ROI Number?
- How Do You Value Benefits That Don’t Show Up on a Spreadsheet?
- How Does ROI Vary Across Different Industries?
- What I’ve Seen Actually Break Automation ROI Projections
- Put Your ROI Case Into Action With a Real Pilot
- Sources
- FAQ
Why Workflow Automation ROI Matters More Than a Feature List
Finance teams and procurement don’t approve automation projects on vibes. They want a number that survives scrutiny: risk-adjusted, tied to a real baseline, and honest about what it cost to get there. A tool that saves time but can’t prove it in dollars gets deprioritized at budget season, no matter how much your team likes using it.
This is where a lot of automation pitches fall apart. They report hours saved without ever pricing those hours, or they compare “before” to “after” using two different measurement windows. EasyFlow’s own customer data points to a more durable pattern: teams using magic links to bring in external collaborators without account creation see fewer follow-up emails and faster handoffs, because the friction that used to stall a process disappears at the exact point where most workflows break down.
A few things separate a credible ROI case from a hopeful one:
- A documented baseline measured before any tooling changes.
- A fully loaded cost basis, not just subscription price.
- A named owner tracking the metric past the pilot phase.
This piece draws on Forrester’s TEI methodology, NiCE’s customer benchmarks, and practitioner frameworks, plus field notes from Harsh on the EasyFlow team, who works directly with operations leaders running these calculations.
How Do You Calculate Workflow Automation ROI?
The math is simpler than most vendors make it sound. The Automators lay out a practical five-step method that any operations leader can run on a spreadsheet in an afternoon.
- Measure the baseline cost. Multiply hours spent on the manual process by the fully loaded hourly rate of whoever does it now.
- Estimate the automated cost. Include the remaining human oversight time plus any per-transaction software cost.
- Compute gross benefit. Subtract automated cost from baseline cost.
- Subtract total cost of ownership. Deduct licensing, integration, training, and maintenance from gross benefit to get net benefit.
- Calculate ROI and payback. ROI% = (net benefit / total investment) × 100. Payback months = total investment / monthly net benefit.
Here’s a simple version using round numbers. Say a 10-person team spends 15 hours a week on manual approval routing, at a fully loaded rate of $40/hour. That’s $600/week, or roughly $31,200 a year in labor cost tied up in one process.
Run this with a conservative utilization factor. A risk-adjusted figure that holds up in month four beats an optimistic one that gets walked back in front of the same stakeholders.
Which KPIs Actually Prove Automation Is Working?
Hours saved is the metric everyone reaches for first, and it’s also the one finance trusts least on its own. Frameworks that go beyond time saved map benefits across four categories, and each one needs its own measurement approach.
- Cost reduction: hours reclaimed × fully loaded hourly rate, tracked monthly against the pre-automation baseline.
- Speed: cycle time reduction, measured from process start to completion, not just the automated step.
- Quality: error and rework rate, priced by the cost to fix a mistake plus any downstream delay it caused.
- Revenue impact: faster deal cycles, quicker renewals, or reduced churn tied directly to a process change.
Cost reduction and speed are the easiest to defend because they’re directly observable. Quality and revenue impact are softer at first. You can harden them over 90 days by running a cohort comparison, teams using the new workflow against teams still on the old process, and tracking the delta instead of a single before/after snapshot. That comparison is what turns “we think it’s helping” into a number a CFO will actually cite.
What ROI and Payback Should You Expect by Use Case?
Payback windows vary enormously by department, and pretending otherwise is how ROI projections get laughed out of a budget review. Department-level benchmarks show the spread clearly:
- Quick-win automations like form-to-CRM routing or automated reminders often pay back in days to a few weeks. Low complexity, low integration cost.
- Mid-complexity workflows like employee onboarding or invoice processing typically pay back in 1 to 3 months.
- Contact center automation commonly returns in 6 to 9 months per NiCE’s benchmarks.
- Enterprise back-office transformation stretches to 9 to 18 months, largely because of integration scope and change management overhead.
Three variables move these windows more than anything else: transaction volume, the wage rate of whoever currently does the work, and how many systems the process touches. A high-volume, high-wage, single-system process is the fastest possible payback profile. A low-volume process spanning five disconnected tools, even a genuinely painful one, will take longer to pay for itself no matter how good the automation platform is.
What Belongs in Your Automation Cost Model?
Total cost of ownership is where most ROI projections quietly become fiction. A complete model needs licensing, integration work, data cleanup, professional services, training and change management, ongoing maintenance, and any usage-based AI compute costs.
The most common modeling mistakes, in order of how often they wreck a projection:
- Reporting license cost only and ignoring implementation.
- Underestimating integration, which routinely runs 30% to 50% over initial estimates.
- Skipping adoption risk, assuming every employee uses the new process correctly from day one.
- Forgetting annual maintenance, which typically runs 10% to 20% of build cost per year.
Adjust for these with a Forrester-style risk reduction on your benefit estimates, and always present three scenarios, conservative, base, and optimistic, rather than one confident number.
Pro Tip: Build your conservative scenario first, get it approved, then show the base case as an upside. Reviewers trust a number that starts cautious far more than one that starts impressive and gets negotiated down.
How Do You Build an ROI Case Finance Will Approve?
Before you automate anything, capture baseline hours, error rates, cycle times, transaction volumes, and the dollar value of each transaction. Without this, you have no comparison point six months from now.
- Set checkpoints at 30, 60, and 90 days to measure actual versus projected benefit.
- Run a cohort or A/B comparison where possible, isolating the automated process from unrelated changes.
- Package three deliverables: a scenario table (conservative/base/optimistic), a payback chart, and a live KPI dashboard.
- Decide the scale-after-pilot criteria before the pilot starts, so success isn’t defined retroactively.
Mapping the process first, before selecting or configuring any tool, is what makes the baseline numbers accurate instead of guessed.
How Much Does Change Management Affect the ROI Number?
The automation can be flawless and the ROI can still collapse if nobody adopts it. This is the piece most ROI models leave out entirely, and it’s usually the difference between a pilot that scales and one that quietly dies after month three.

Adoption risk isn’t a soft consideration. It’s a direct multiplier on your gross benefit.
The fix isn’t more training slides. It’s reducing the friction that makes people avoid the new process in the first place. Workflows that require every participant to create an account, log in, and learn a new interface see slower adoption than workflows where external collaborators simply click a link and complete their step. That gap between “technically deployed” and “actually used” is where most projected ROI quietly evaporates.
Budget change management as a line item, not an afterthought. Assign a specific owner for adoption tracking during the first 90 days, separate from whoever owns the technical build. Watch usage rate, not just completion rate, because a process people complete reluctantly and slowly is not the same win as one they complete because it’s genuinely easier. Teams that treat rollout communication and workflow redesign as part of the build, not a post-launch scramble, consistently hit their projected payback windows closer to the base case than the conservative one.
How Do You Value Benefits That Don’t Show Up on a Spreadsheet?
Not every benefit of automation shows up as a line item, and pretending otherwise makes your case weaker, not stronger. Employee retention, faster onboarding for new hires, and better stakeholder communication all move the needle on long-term value, even when they resist a clean dollar figure in month one.
The move is to proxy them, not skip them. Retention has a cost you can estimate: the fully loaded cost of replacing an employee who leaves due to preventable frustration with manual, repetitive work. If automation reduces the tedious parts of a role that historically drove turnover, track turnover rate for that role before and after, and price the delta using your actual replacement cost, not a generic industry average.
Stakeholder communication is measurable too, indirectly. Track the number of status-check emails or “where are we on this” messages before and after a workflow goes live. A drop here isn’t just a nice quality-of-life improvement, it’s reclaimed attention that shows up elsewhere as faster decision-making. EasyFlow customers have reported fewer follow-ups and less manual chasing once external collaborators could complete steps without waiting on internal coordination.
Strategic value compounds over time in a way a single ROI snapshot misses. A process that’s automated once tends to get refined, extended, and copied into adjacent workflows. Track this by counting how many additional processes get automated in the 12 months after your first pilot succeeds. That number, more than any single ROI percentage, tells you whether automation became a capability or stayed a one-off project.
How Does ROI Vary Across Different Industries?
ROI benchmarks aren’t interchangeable across industries, because the underlying cost drivers differ. A contact center’s ROI comes mostly from reduced handle time and staffing efficiency. A professional services firm’s ROI comes more from faster client onboarding and fewer billing errors. A healthcare back office sees returns concentrated in claims processing and compliance documentation, where error costs are unusually steep.
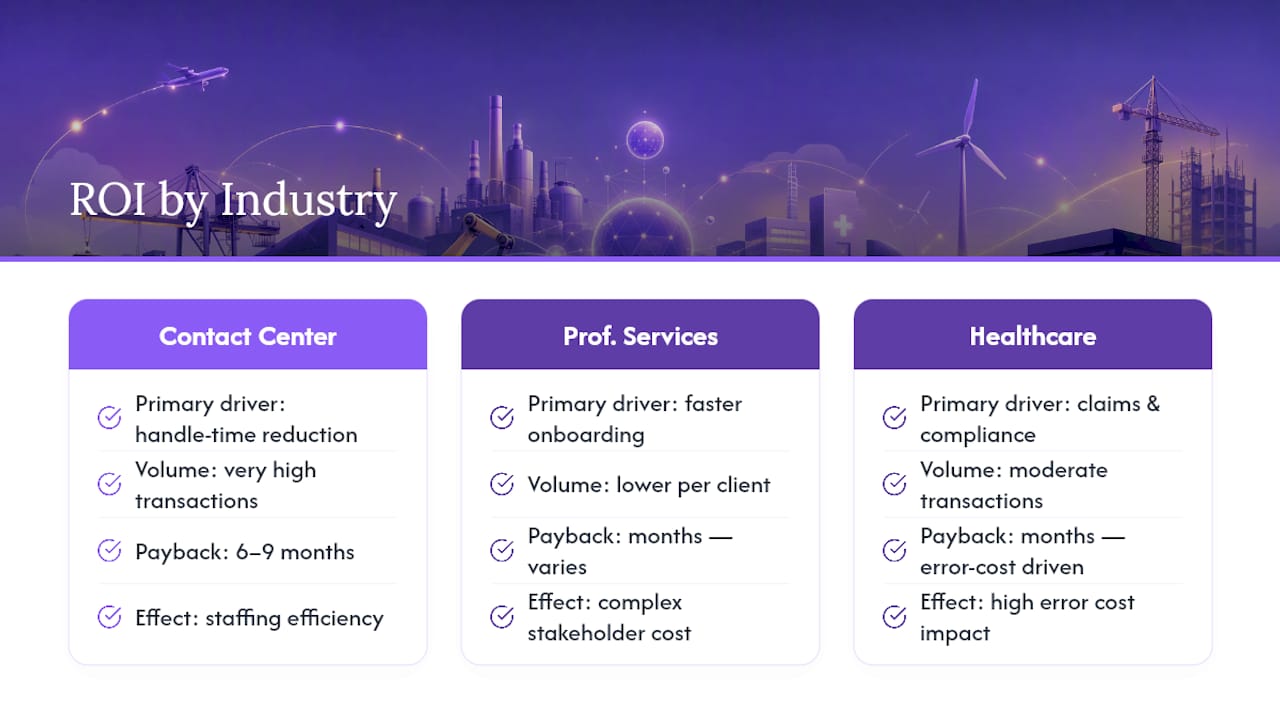
In high-transaction-volume environments like customer service, NiCE’s data shows payback in 6 to 9 months, largely because every automated interaction repeats hundreds or thousands of times a month, so small per-transaction savings compound fast. Compare that to a mid-sized professional services firm automating client implementation workflows: lower volume per client, but each implementation touches multiple external stakeholders, meaning the friction cost of manual coordination is proportionally higher. That’s exactly the profile where reducing onboarding friction through external-collaborator access tends to move the needle faster than pure time-tracking would suggest.
HR-heavy organizations running new-hire onboarding at scale see a different pattern again: the dollar value per transaction is lower than a finance department processing large invoices, but the volume and the downstream cost of a bad first-week experience (higher early attrition, slower time-to-productivity) push real ROI higher than a narrow hours-saved calculation would capture. The lesson across all three: pick the benchmark that matches your actual volume, wage rate, and error cost profile, not the average ROI number from a case study in a different industry.
What I’ve Seen Actually Break Automation ROI Projections
The pitfalls I see most aren’t technical, they’re measurement discipline problems. Teams skip the baseline, then argue about whether automation “worked” using memory instead of numbers. Or they measure hours saved in week two, when adoption is still shaky, and extrapolate that partial number across a full year.
The teams that get this right track real KPIs from day one and revisit them at 90 days, not just at launch. EasyFlow’s own onboarding and approval workflows show the pattern clearly: friction drops fastest when external collaborators can act on a magic link without account setup, and that specific reduction in follow-up volume is one of the more reliable early signals a pilot is actually working, well before the full financial picture is in.
Start with a measurable pilot. Trust the number, not the narrative.
— Harsh
Put Your ROI Case Into Action With a Real Pilot
Every formula in this article assumes you have a workflow worth automating and a way to run it without months of setup delay. That’s the part EasyFlow solves directly. Instead of tracking a process across email threads and spreadsheet handoffs, EasyFlow executes it: tasks route automatically, reminders go out without a human chasing anyone, and external collaborators complete their piece through a magic link instead of creating an account first.
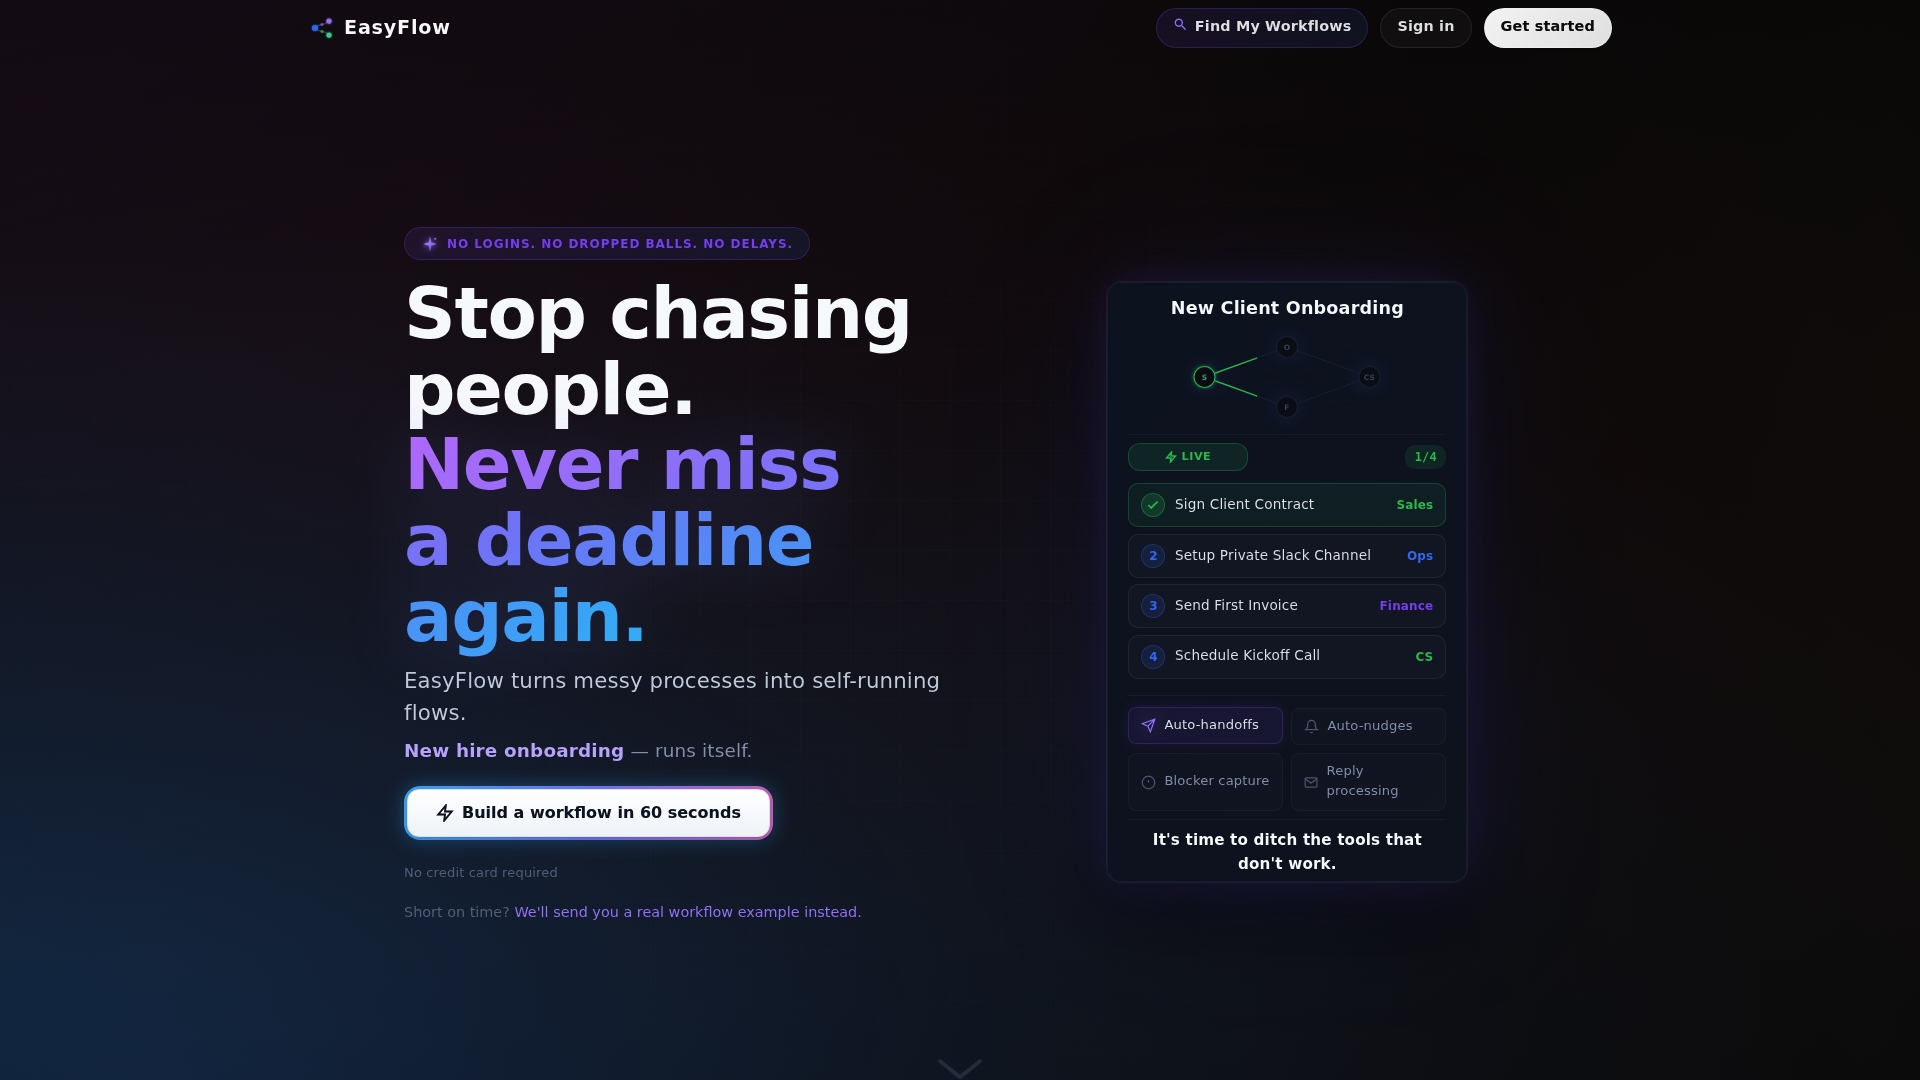
That last part matters more than it sounds. Account friction is one of the quiet reasons pilots stall in month one, before you ever get to measure real ROI. A client, contractor, or new hire who has to register for a tool just to approve a document or upload a file is a client who delays, and every delay shows up as a longer cycle time in your baseline numbers. Removing that step is often the difference between a pilot that hits its 90-day checkpoint on schedule and one that’s still “getting set up” three months in.
If you’re ready to build your own baseline and start tracking real numbers instead of estimates, start a trial with EasyFlow and run your first workflow this week.
Sources
Forrester’s TEI study, NiCE’s ROI benchmarks, The Automators’ calculation method, and Marshall Tech’s TCO framework anchor the figures above.
- AI workflow automation ROI | How to calculate & maximize your return | NiCE
- The ROI of Automation: How to Calculate What AI Actually Returns | The Automators
- How to Estimate Automation ROI: A Practical Framework 2026 | Marshall Tech
FAQ
What Is a Realistic Payback Period for Workflow Automation?
Most quick-win automations pay back in weeks to a few months, while enterprise back-office projects typically take 9 to 18 months depending on integration scope.
What Costs Should Be Included in an Automation ROI Calculation?
Include licensing, integration, data cleanup, training, change management, and ongoing maintenance, not just the subscription price, since integration alone often runs well over initial estimates.
Which Processes Have the Best Automation ROI?
Processes that are high-volume, rule-based, and currently handled by moderately high-paid staff tend to return the fastest, since every automated transaction compounds the savings.
How Does EasyFlow Improve Workflow Automation ROI?
EasyFlow reduces onboarding friction by letting external collaborators complete tasks through a magic link instead of creating an account, which cuts follow-ups and shortens cycle time in the baseline measurements that drive ROI.
How Do You Present ROI to Finance or Procurement?
Present three scenarios, conservative, base, and optimistic, backed by a documented baseline and a 90-day measurement plan, rather than a single optimistic number.