
How to Measure Workflow Efficiency Metrics That Matter

What is workflow efficiency and how do you measure it?
Workflow efficiency is the ratio of value-adding time to total cycle time in a process. The standard formula for quantifying it is Process Cycle Efficiency, or PCE: divide the time spent on work that actually moves a task forward by the total elapsed time from start to finish. A 40% PCE means 60% of your cycle time is waste, whether that’s a task sitting in a queue, getting reworked, or waiting on an approval.
That 60% is where most operations teams have room to improve. Total cycle time breaks down into three main components: active processing time, queue time (waiting), and rework time. Only processing time that directly advances the output counts as value-adding. Everything else is waste by definition, even if it feels unavoidable.
Here’s a concrete example: a 40-hour process cycle where 16 hours involve active, value-adding work yields a PCE of 40%. The remaining 24 hours are queue time, rework, or handoff delays. That gap is your improvement target.
Key terms to know before you go further:
- Process Cycle Efficiency (PCE): Value-adding time ÷ total cycle time, expressed as a percentage
- Cycle time: Total elapsed time from process start to completion
- Value-adding time: Work that directly transforms inputs into outputs the customer or stakeholder needs
- Non-value-adding time: Waiting, rework, redundant approvals, and unnecessary handoffs
- Queue time: Time a task spends waiting before active work begins
- Rework time: Time spent correcting errors or redoing completed steps
- Throughput: The number of units a process completes per unit of time
Key metrics for measuring workflow efficiency
PCE is the headline number, but it doesn’t tell the full story on its own. Accurate workflow performance indicators span five categories: outcome, flow, quality, capacity, and experience. Most teams should track a balanced number of KPIs per critical workflow, enough to catch problems early without drowning in data.
Flow metrics track whether work is actually moving:
- Process cycle time: Total elapsed time per task or unit from intake to completion
- Queue time: Time spent waiting at each stage, often the largest source of waste
- Throughput rate: Units completed per hour, day, or shift
Quality metrics reveal whether work is correct the first time:
- Error rate: Errors per total outputs, expressed as a percentage
- Rework rate: Percentage of completed tasks that require correction before acceptance
- First-pass yield: Percentage of outputs that pass quality checks without rework
Capacity metrics show whether your resources are balanced against demand:
- Resource utilization rate: Active work time ÷ total available time
- Setup-to-production ratio: Time spent on setup versus actual production
- Queue depth: Number of tasks waiting at any given stage
Outcome and experience metrics confirm the process is delivering what it should:
- SLA attainment: Percentage of tasks completed within agreed service-level timeframes
- Customer satisfaction (CSAT): Stakeholder feedback on process outputs
- Backlog age: How long unresolved items have been sitting in the queue
One distinction worth keeping in mind: leading indicators (queue depth, backlog age, approval wait time) let you act before a problem compounds. Lagging indicators (error rate, CSAT, SLA attainment) confirm what already happened. A team that tracks only lagging metrics is always reacting, never anticipating.
Pro Tip: Resist the urge to track everything. A dashboard with 20 metrics is a dashboard nobody uses. Pick the 5–7 that directly answer your most pressing operational questions and build from there.
How to start measuring workflow efficiency in practical steps
Getting accurate data requires a structured approach. Jumping straight to dashboards without mapping the process first produces metrics that measure the wrong things.
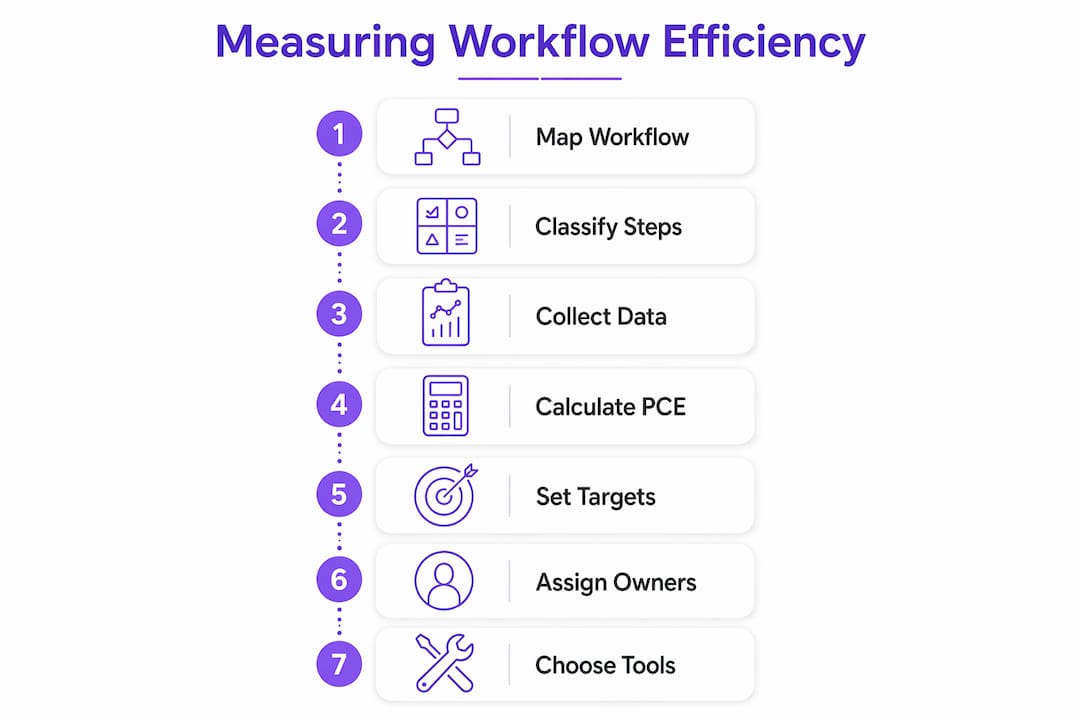
Step 1: Map your workflow stages
Before you can measure anything, you need a clear picture of every step in the process. Workflow mapping identifies each stage, the handoffs between them, and who owns each step. Use a process flow diagram to make the sequence visible. This is where you separate value-adding steps from the ones that exist out of habit or organizational inertia.

Step 2: Classify each step as value-adding or waste
Walk through the mapped process and label each step. Ask one question for each: does this step directly transform the input into something the end recipient needs? If the answer is no, it’s a candidate for elimination or reduction. Common waste categories include redundant approvals, manual data re-entry, and handoffs that exist only because two systems don’t talk to each other.
Step 3: Collect baseline data
You need a baseline before you can set targets. Collect data on cycle time, queue time, and error rates for each stage over a representative period, typically two to four weeks. Automated data capture is more reliable than manual logs. When operators self-report output, rounding and omissions are built in from day one. Connecting data collection to login IDs, timestamps, or system-generated records removes that bias.
Step 4: Calculate your PCE and identify bottlenecks
With baseline data in hand, calculate PCE for the overall process and for each individual stage. Stages with low PCE are your bottlenecks. A stage where tasks spend 80% of their time waiting is a more urgent problem than a stage with a slightly elevated error rate. Prioritize by impact on total cycle time, not by what’s easiest to fix.

Step 5: Set realistic targets
A 10–15% improvement in PCE over a single quarter is a realistic target for initial optimization efforts. Don’t set targets in isolation. Compare your baseline against industry benchmarks where available, and factor in the specific constraints of your process before committing to a number.
Step 6: Assign owners and define action rules
A metric without an owner is just a number on a screen. Every KPI needs one accountable person who reviews it on a defined cadence, explains movement, and triggers action when a threshold is crossed. Define what “green,” “watch,” and “intervene” mean before the number changes, not after. Specify the action for each threshold: reroute work, escalate, rebalance capacity, or update a standard operating procedure.
Step 7: Choose tools that support measurement
Spreadsheets work for initial mapping but break down fast when you need real-time visibility. Purpose-built workflow tools provide dashboards, status tracking, and analytics that make it practical to monitor cycle time, queue depth, and error rates without manual aggregation. Workflow automation also reduces manual data entry errors, which skew quality metrics if left unchecked.
Pro Tip: Build quality checks into the workflow itself, not as a downstream audit. Conditional logic and direct form-to-data connections catch errors at the source, before they generate rework that inflates your cycle time.
How operators measure workflow efficiency at the individual level
Aggregate process data tells you a workflow has a problem. Operator-level data tells you why. Measuring operators individually by comparing actual cycle times and rejection rates against standards is what separates a process flaw from a skill gap or an equipment failure. Without that distinction, you’re guessing at root causes.
The two core components of operator efficiency
Operator efficiency has two distinct dimensions that must be tracked separately:
- Production rate efficiency: How closely an operator’s actual cycle time matches the standard cycle time for that task
- Quality efficiency: How the operator’s rejection rate compares to the allowed rejection rate for that process
Tracking only one gives you an incomplete picture. An operator who hits cycle time targets but generates three times the average rejection rate is not efficient. Conversely, an operator with excellent quality but consistently slow cycle times may be masking a training gap or a process design issue.
Why machine-level data isn’t enough
Most operations track performance at the machine or line level, not the individual level. That aggregation hides variation. When Operator C consistently produces more rejects than Operator D on the same machine running the same part, that’s a signal worth acting on. But you can only see it if you’re capturing data at the individual level.
Automated data capture linked to operator IDs (login credentials or RFID) eliminates the self-reporting problem. When the machine is the source of truth, the data can’t be rounded or adjusted after the fact. Automated capture generates shift-level individual efficiency reports covering cycle time adherence, rejection rates, downtime contribution, and skill-matching data across machines.
Key operator-level metrics to track
- Actual vs. standard cycle time: The gap between what an operator takes and what the process standard requires
- Rejection rate vs. allowed rate: Individual quality performance against the process benchmark
- Downtime contribution: How much of a machine’s idle time is tied to a specific operator
- Setup-to-production ratio: Time spent on setup versus active production per shift
- Workload balance: Distribution of tasks and touch time across operators to identify overloading
Pushing utilization to 100% destroys throughput by removing the buffer capacity needed to handle process variability. The goal is high but sustainable utilization, with a focus on reducing queue time rather than maximizing busy time. Buffer capacity is what keeps a process from collapsing when variability spikes.
Continuous improvement at the operator level
Numbers alone don’t close the loop. Frontline employees consistently identify bottlenecks that data misses entirely: redundant approvals, unclear handoff instructions, communication gaps between shifts. Building a feedback channel where operators can flag process pain points in real time adds qualitative signal to your quantitative data.
Workflow efficiency is a continuous improvement cycle, not a one-time audit. Operator-level data feeds back into process design, training decisions, and workload balancing. When performance incentives are tied to machine-verified output rather than supervisor estimates, disputes drop and productivity improves. Operations teams using automated capture with performance-linked incentives have seen 12% productivity gains within two months of implementation.
Pro Tip: When you first switch from manual logs to automated capture, expect the real numbers to look worse than your previous data. That’s not a failure. It means your baseline was inaccurate. The new numbers are what you actually have to work with.
How EasyFlow helps you act on what your metrics reveal
Measuring workflow efficiency is only half the job. The other half is fixing what the data exposes. EasyFlow automates the process steps that generate the most waste: manual handoffs, follow-up tasks, and approval chains that stall in someone’s inbox.

Unlike tools that only track tasks, EasyFlow executes processes. External collaborators can complete assigned steps via magic links without creating accounts, which cuts onboarding friction and keeps cycle times from inflating due to access delays. When your PCE measurement reveals that 40% of your cycle time is sitting in queue waiting on a handoff, EasyFlow is built to eliminate exactly that gap.
Start automating your workflows and turn your efficiency metrics into actual process improvements, not just a better-looking dashboard.
Key Takeaways
Workflow efficiency is best measured through Process Cycle Efficiency (PCE), supported by flow, quality, and capacity metrics, each tied to an owner and a defined action rule.
| Point | Details |
|---|---|
| PCE is the core metric | Value-adding time ÷ total cycle time; a 40% PCE means 60% of your cycle is waste. |
| Track 5–7 KPIs per workflow | Balance outcome, flow, quality, capacity, and experience metrics to catch problems early. |
| Set a realistic improvement target | A 10–15% PCE improvement per quarter is realistic for initial efforts. |
| Measure operators individually | Aggregate data masks variation; individual cycle time and rejection rate data reveals root causes. |
| Metrics need owners and action rules | A KPI without an accountable owner and defined thresholds is a passive number, not a management tool. |
FAQ
How do you measure workflow efficiency?
Workflow efficiency is measured using Process Cycle Efficiency (PCE): divide value-adding time by total cycle time and express the result as a percentage. Supporting metrics like error rate, queue time, and resource utilization give a fuller picture of where waste occurs.
What are the key metrics for measuring efficiency?
The core metrics span five categories: flow (cycle time, throughput, queue time), quality (error rate, rework rate, first-pass yield), capacity (utilization rate, queue depth), outcome (SLA attainment), and experience (CSAT). Most teams track 5–7 KPIs per critical workflow.
How do you measure flow efficiency specifically?
Flow efficiency is calculated the same way as PCE: value-adding time divided by total lead time. A process where tasks spend most of their elapsed time waiting rather than being actively worked on has low flow efficiency, regardless of how fast individual steps run.
What are the four types of performance metrics?
Operational performance metrics typically fall into four types: outcome metrics (did the process deliver the intended result?), flow metrics (is work moving without delay?), quality metrics (is work correct the first time?), and capacity metrics (is workload balanced against available resources?). Experience metrics, such as CSAT, are often added as a fifth category.