
Project Status Update Automation: Examples and Templates

Automated project status updates pull live data from your PM tools, format it into a stakeholder-ready report, and distribute it on a schedule or trigger, without anyone manually copying numbers into a slide deck. The payoff is real: project managers spend a substantial share of their time on reporting and coordination, and that is exactly the overhead automation targets. The most common outputs you can generate automatically include:
- Daily standup pre-brief: yesterday’s completed tasks, today’s planned work, and current blockers pulled from your task tool and posted to Slack before the meeting starts
- Weekly executive summary: a 200–300-word narrative with RAG status, milestone progress, and top risks, delivered by email every Friday morning
- Client status report: milestone completion percentages, deliverables shipped, and decisions needed, formatted in plain language and sent as a PDF or shared doc link
- Portfolio health digest: a rolled-up RAG view across all active projects, posted to a PMO dashboard and emailed to leadership weekly
Teams that implement even one of these automations typically reclaim several hours per week and eliminate the status drift that happens when reports are assembled manually from memory.
Key Takeaways
Automated project status updates save the most time when you start with one high-value report, enforce a single source of truth per field, and run a human review phase before enabling auto-send.
| Point | Details |
|---|---|
| Start with one report | Automate the weekly executive summary first; it is high-visibility and low-frequency, making errors easy to catch. |
| Single source of truth | Assign one system to own each data field; two sources for the same metric guarantees status drift. |
| Use both trigger types | Combine scheduled aggregation for routine reports with webhook triggers for blocker and milestone alerts. |
| Draft mode before auto-send | Run the automation in draft mode for 2–3 weeks and have a PM review each output before it reaches stakeholders. |
| EasyFlow for execution | EasyFlow connects sources, runs scheduled or event-triggered workflows, and distributes reports across channels with no account required for external collaborators. |
Table of Contents
- What does “project status update automation” actually mean for PMs?
- What every automated status update must include
- Which report types should you automate, and how often?
- What automation patterns actually work in practice?
- How to set up an automated status update workflow
- Four concrete automation examples you can implement now
- Copy-ready templates and an AI prompt for summarization
- How to keep automated updates accurate and trustworthy
- A research-backed architecture for an AI-powered status report generator
- When automation helps and when it gets in the way
- EasyFlow runs these automations without the integration overhead
- Sources
- FAQ
What does “project status update automation” actually mean for PMs?
Status update automation means connecting your source data (task tools, issue trackers, spreadsheets, chat) to a formatting and distribution layer so that reports generate themselves. The human job shifts from assembling the report to reviewing and acting on it.
The business case is straightforward. PMI’s Pulse of the Profession documents how reporting and coordination activities consume a disproportionate share of PM time, time that could go toward risk management, stakeholder alignment, and actual delivery decisions. Beyond time savings, automated reports are consistent: every stakeholder gets the same data pulled from the same source at the same moment, which removes the version-drift problem that plagues manually assembled updates.
A few signals that your team is ready for automation:
- You maintain more than two or three recurring status reports with overlapping data
- Different stakeholders are receiving different numbers for the same metric
- PMs spend Friday afternoons assembling reports instead of resolving blockers
- Your project data lives in three or more tools with no single rollup view
Pro Tip: Start with your weekly executive summary, not your daily standup. It is high-visibility, has a clear audience, and runs once a week, so errors are catchable before they compound. Automate the low-risk, high-value report first, then expand.
The workflow automation case for project managers goes beyond reporting: once you have automated data collection in place, the same infrastructure supports deadline reminders, escalation triggers, and handoff notifications.
What every automated status update must include
A status update is only useful if it contains the right fields. Automate a report that omits blockers or ownership and stakeholders will stop reading it within two weeks.
The mandatory fields for any automated status update are:
- Project name and reporting period (e.g., “Alpha Redesign — Week of June 9”)
- Short summary (2–4 sentences on overall health and the week’s headline)
- RAG/health status (Red / Amber / Green, derived from milestone slippage or overdue task thresholds)
- Progress vs. plan (percent complete, tasks completed this period vs. planned)
- Milestone status (on track / at risk / delayed, with target and actual dates)
- Risks and blockers (top 2–3, each with owner and mitigation)
- Next steps with owners (what happens before the next report, who is responsible)
Each field should have exactly one source of truth. Percent complete, for example, should come from task counts in your PM tool, not from a manually updated field in a spreadsheet. The moment a field has two sources, status drift returns.
Here is how common source data maps to the derived metrics that populate these fields:
| Source data | Derived metric | How it is calculated |
|---|---|---|
| Tasks marked complete this period | Completed task count | Count of tasks with completion date in reporting window |
| Total tasks vs. completed tasks | Percent complete | (Completed ÷ Total) × 100 |
| Milestone target date vs. today | Milestone health | Green if on track, Amber if within 7 days of slip, Red if past due |
| Tasks with “blocked” status or flag | Blocker count | Count of tasks with blocker tag or status |
| Overdue task count vs. threshold | RAG status | Red if overdue count exceeds defined threshold |
Microsoft Planner’s updated integrations and dashboard widgets now support automated synchronization that can feed several of these fields directly, which reduces the need for custom connectors in Microsoft-stack environments.
Which report types should you automate, and how often?
Not every report needs the same cadence, and sending a 500-word executive summary to your dev team every morning is a fast way to get everyone to ignore your automation entirely.
Daily standup pre-brief runs each morning before the standup meeting. Audience: the delivery team. Channel: Slack or Teams. Content: yesterday’s completed tasks, today’s planned items, and any open blockers. Keep it under 150 words. This one has the highest daily utility and the lowest tolerance for errors, so it should be one of the last automations you enable for auto-send.
Weekly team update runs every Monday morning or Friday afternoon. Audience: the full project team. Channel: Slack, Teams, or a project management tool comment. Content: week’s progress, upcoming milestones, and open risks. 200–300 words.
Weekly executive summary runs every Friday at a fixed time. Audience: sponsors, steering committee, senior leadership. Channel: email, with a link to the live dashboard. Content: RAG status, milestone health, top 3 risks, and decisions needed. 250 words maximum. Executives read this on mobile; keep it scannable.
Milestone report triggers when a milestone is reached or missed. Audience: project sponsor and key stakeholders. Channel: email. Content: what was delivered, what comes next, and any scope or timeline implications.
Client-facing report runs weekly or bi-weekly depending on contract terms. Audience: external client contacts. Channel: email with a PDF attachment or a shared doc link. Content: deliverables shipped, percent complete by workstream, decisions needed from the client. Tone must be plain language, not internal jargon.
Portfolio health digest runs weekly for PMO leadership. Channel: PMO dashboard plus a weekly email digest. Content: RAG rollup across all active projects, flagging any project that shifted status since last week.
For routing: use Slack or Teams for internal teams who live in those tools, email or PDF for executives and clients who expect a formal artifact, and a live dashboard for PMO and leadership who want to drill down on demand.
What automation patterns actually work in practice?
Three patterns cover most real-world project status update automation scenarios.
Scheduled aggregation is the simplest. A job runs on a cron schedule (e.g., every Friday at 4:00 PM), queries your PM tool’s API, pulls the required fields, formats them into a template, and sends the output. This works well for weekly executive summaries and client reports where a fixed cadence is expected. The downside is latency: a blocker that appears Saturday morning won’t surface until the next scheduled run.
Event-driven updates use webhooks to trigger a workflow the moment something changes: a task moves to “blocked,” a milestone is marked complete, or an overdue threshold is crossed. The report or notification fires within seconds of the event. Webhooks reduce latency and API call volume compared with frequent polling and are the better choice whenever your PM tool supports them.
Hybrid pattern combines both: a daily or weekly scheduled aggregation for the standard report, plus event-driven triggers for exceptions (a blocker appears, a milestone slips, overdue tasks cross a threshold). This is the pattern most mature teams land on because it handles both routine reporting and real-time escalation.
The data flow for any of these patterns follows the same sequence:
- Source systems (Jira, GitHub, Asana, Google Sheets, Slack) provide raw data
- Aggregator / ETL layer collects and normalizes data across tools
- Summarizer / transform layer applies templates or AI summarization
- Distribution layer routes formatted output to email, Slack, dashboard, or PDF
Pro Tip: If your PM tool offers webhooks, use them for blocker and milestone events even if you use polling for everything else. A blocker notification that arrives 6 hours late because of a polling interval is a blocker notification that arrives too late.
Automated deadline reminder workflows follow the same trigger-and-distribute logic and can share infrastructure with your status reporting pipeline once it is in place.
How to set up an automated status update workflow
This sequence works whether you are using a no-code automation platform or building a custom integration.
- Pick one report and define its audience. Name the stakeholders, their channel preference, and the exact fields they need. Do not try to automate five reports at once.
- Identify your data sources and assign a single source of truth for each field. Percent complete comes from the task tool. RAG status is derived from milestone and overdue data, not from a manually updated field.
- Choose your trigger and frequency. Scheduled (cron) for routine reports, webhook for exception alerts.
- Map source fields to template fields. Write out the mapping explicitly: “tasks completed this week” → “Progress this period” field in the template.
- Build the summarization step. For structured data, a template with variable substitution is enough. For narrative summaries, use an AI prompt (see Section 8 for a ready-to-use prompt).
- Format the output for the channel. Slack messages use block kit JSON. Emails use HTML or plain text. PDFs require a rendering step. Match the format to the audience.
- Test with a small audience first. Send the first three runs to yourself and one other person. Validate that every field populates correctly and the RAG logic fires as expected.
- Monitor and iterate. Check data freshness, watch for anomalies, and review the template quarterly.
For testing, define acceptance criteria before you start: every mandatory field must populate, RAG must match manual assessment for the test week, and the report must arrive within 5 minutes of the scheduled trigger. Keep a rollback plan: know how to disable the automation and revert to manual for one cycle if something breaks.
Pro Tip: Run the automation in “draft mode” for the first 2–3 weeks: generate the report but route it only to the PM for review before it goes to stakeholders. This builds confidence in the data and catches edge cases (a holiday week, a project that just kicked off with zero tasks) before they embarrass you in front of a client.
Asana’s developer documentation includes a Google Apps Script walkthrough that covers polling for project statuses, deduplication logic, and scheduling, a practical reference for the polling-based setup step.
Four concrete automation examples you can implement now
These are full blueprints: inputs, processing, output, and distribution. Each one is ready to adapt.
Weekly executive summary
Inputs: completed task count, milestone status (on track / at risk / delayed), top 3 risks with owners, decisions needed.
Processing: an AI summarization step (see Section 8 for the prompt) generates a 250-word narrative. A RAG derivation rule sets status: Green if all milestones on track and overdue tasks below threshold, Amber if one milestone at risk or overdue count elevated, Red if a milestone is delayed or a blocker is unresolved past 48 hours.
Output: a 250-word email with a subject line of “Project Alpha: Weekly Status — [Green/Amber/Red] — [Date],” a one-line RAG summary at the top, then milestone status, risks, and decisions needed.
Distribution: email to sponsor and steering committee every Friday at 5:00 PM, plus a dashboard update.
Implementation checklist: confirm milestone data is current in the PM tool by Thursday EOD; set the RAG threshold rules in the automation config; validate the email renders correctly on mobile.
Daily standup pre-brief
Inputs: tasks completed yesterday (pulled from PM tool), tasks planned for today (assigned and due today), tasks with “blocked” status.
Processing: a short template fills three sections: “Done yesterday,” “Planned today,” “Blockers.” No AI needed; variable substitution is enough.
Output: a Slack message under 150 words, posted to the team channel at 9:00 AM. Example snippet:
Alpha Team — Daily Brief (Tuesday, June 10) Done yesterday: Finalized API schema (J. Torres), completed QA pass on login module (M. Singh) Today: Deploy staging environment, begin integration testing Blockers: Staging credentials not yet provisioned — owner: DevOps (J. Kim, due today)
Distribution: Slack, automated post to the team channel. Formatting Slack messages with block kit and interactive drill-down buttons lets team members click through to the full task list without leaving Slack.
A TPM case study from Cedar documents a similar pattern using Slack activity as the input source, with Gemini summarizing the day’s messages and updating Jira, projecting savings of 6–8 hours per team per week.
Client status update
Inputs: milestone percent complete by workstream, deliverables shipped this period, decisions or approvals needed from the client.
Processing: rewrite technical task names into business outcomes. “Completed API schema” becomes “Backend data layer design finalized.” Tools that convert technical activity into client-facing language handle this translation automatically and reduce the time spent on narrative editing.
Output: a 300-word email plus a PDF attachment, or a link to a shared Google Doc that updates automatically. Subject line: “Project Alpha: Status Update — [Date].”
Distribution: email to client contacts every other Friday. For external collaborators who need to respond or approve items, magic-link-based workflows let clients complete actions without creating an account in your PM tool. See how to track client onboarding progress automatically for a practical pattern.
Portfolio health digest
Inputs: RAG status for each active project, any project that changed RAG status since last week, projects with overdue milestones.
Processing: normalize RAG across projects using the same threshold rules. Flag any project that moved from Green to Amber or Amber to Red since the previous digest.
Output: a PMO dashboard update plus a weekly email digest. The email lists each project on one line: project name, RAG status, one-sentence headline, and the PM owner. Red projects get a short paragraph explaining the issue and the mitigation plan.
Distribution: PMO dashboard (live, always current) plus email to PMO leadership every Monday at 8:00 AM.
Copy-ready templates and an AI prompt for summarization
These templates are designed to be dropped directly into your automation. Fields in brackets are programmatically filled from your data source.
Email template: weekly executive summary
Subject: [Project Name]: Weekly Status — [RAG Status] — [Reporting Date]
Status: [Green / Amber / Red] Summary: [2–3 sentence AI-generated narrative: overall health, headline achievement, headline risk]
Milestone progress: [Milestone 1]: [Status] — [Target date] [Milestone 2]: [Status] — [Target date]
Top risks:
- [Risk description] — Owner: [Name] — Mitigation: [Action]
- [Risk description] — Owner: [Name] — Mitigation: [Action]
Decisions needed: [Decision or approval required, owner, deadline]
Next steps: [Top 2–3 actions before next report, each with owner]
Slack template: daily standup pre-brief
AI prompt for executive summary generation
Use this prompt in your summarization step. Replace bracketed fields with live data before sending to the model.
You are a project reporting assistant. Generate a concise executive status update from the following project data. Output format: (1) one-sentence RAG status with justification, (2) a 2–3 sentence summary of overall health and the week’s headline achievement, (3) top 2 risks with owners, (4) decisions needed. Keep total length under 250 words. Use plain business language; avoid technical jargon.
Project name: [Name] Reporting period: [Start date] to [End date] Tasks completed this period: [Count] Tasks overdue: [Count] Milestone status: [List each milestone with on-track / at-risk / delayed] Open blockers: [List with owner and days open] Decisions needed: [List]
The falkster rollout guide recommends generating separate audience-tailored drafts (exec, team, board) from the same data, running manual review for 3–4 weeks, then enabling auto-send once the outputs are consistently accurate.
Template QA checklist before enabling auto-send:
- Every bracketed field populates with real data (no “[undefined]” values)
- RAG logic produces the correct status for a known test week
- AI summary does not hallucinate tasks or milestones not in the input data
- Output renders correctly in the target channel (email client, Slack, PDF)
- A human reviewer has signed off on at least three consecutive outputs
How to keep automated updates accurate and trustworthy
Automation that produces wrong data is worse than no automation. Stakeholders who catch one error stop trusting every subsequent report.
Governance essentials:
- Single source of truth per field. Document which system owns each data point and enforce it. If percent complete can be edited in both Jira and a spreadsheet, it will diverge.
- Role-based access controls. Limit who can modify the automation config, the templates, and the underlying data fields. Changes to a template that go unreviewed can silently corrupt every subsequent report.
- Review gate for auto-send. For the first 4–8 weeks after rollout, route every report to a PM reviewer before it goes to stakeholders. This is not optional for client-facing or executive reports.
- Audit logs. Log every report generation event: timestamp, data snapshot used, distribution list, and any manual edits made before send. This is your defense when a stakeholder questions a number.
- Data retention policy. Decide how long report snapshots are stored. Regulatory or contractual requirements may set a minimum; 90 days is a reasonable default for most teams.
- Privacy for client data. If your automation pulls client-identifiable data into a third-party AI service, confirm your data processing agreements cover that use case.
Monitoring checklist:
- Data freshness: confirm source data was updated within the expected window before the report generates
- Anomaly detection: flag any report where percent complete drops more than 15 percentage points week-over-week (a likely data error, not a real regression)
- Quarterly template review: check that field mappings still match the PM tool’s current schema and that the AI prompt still produces accurate outputs
Pro Tip: For the first 4–8 weeks after rollout, block 30 minutes on Friday afternoon to review the automated output before it sends. You will catch edge cases (a project that just closed, a milestone that was retroactively moved) that no monitoring rule anticipates. After 8 weeks of clean outputs, you can drop the review cadence to spot-checks.
A research-backed architecture for an AI-powered status report generator
Here is a concrete implementation architecture that reflects published open-source work and documented case studies.
Component layer:
| Layer | Component | Example tools |
|---|---|---|
| Source systems | PM tool, issue tracker, chat | Jira, Asana, GitHub, Slack |
| Aggregator / ETL | Data collection and normalization | Google Apps Script, n8n, custom API calls |
| AI summarizer | LLM-based narrative generation | GPT-4o, Gemini, Claude via API |
| Distribution | Multi-channel output | Email (SMTP), Slack API, dashboard webhook |
The open-source automated project status report generator on GitHub demonstrates this exact pipeline: connectors to PM tools, an LLM summarization step, and scheduled distribution, providing a reproducible starting point for teams building a custom implementation.
Implementation notes:
- Rate limits: PM tool APIs enforce rate limits. Build exponential backoff into your polling logic and cache responses where possible to avoid hitting limits on large portfolios.
- Credential management: store API keys in a secrets manager (AWS Secrets Manager, HashiCorp Vault, or your platform’s equivalent), never in the automation script itself.
- Hallucination mitigation: constrain the AI prompt to only the data fields you pass in. Instruct the model explicitly: “Do not infer or add information not present in the input data.” Run a post-generation check that verifies the RAG status in the output matches the derived RAG from your data.
- Review workflow: even in production, route any report where RAG changes from the previous period to a human reviewer before send.
Pro Tip: Before going live, backfill 8–12 weeks of historical project data into your aggregator. This gives you a baseline for trend detection (is percent complete tracking faster or slower than the project average?) and makes anomaly detection rules far more reliable from day one.
When automation helps and when it gets in the way
Automation earns its keep on repetitive, structured updates where the data is clean and the audience expects a consistent format. The weekly executive summary, the daily standup pre-brief, the portfolio RAG digest: these are exactly the reports that should run themselves.
Where automation falls short is in the narrative layer. A project that just had a difficult client conversation, a team that is quietly burning out, a risk that is technically Green on paper but politically Amber: none of that surfaces from task counts. The most dangerous automation failure mode is not a broken pipeline. It is a pipeline that runs perfectly and produces a Green report for a project that is actually in trouble.
The practical rule is this: automate the data, humanize the narrative. Let the system pull the numbers, calculate the RAG, and draft the summary. Then a human reads it before it goes out, at least for anything that goes to a client or an executive. The Cedar case study’s 6–8 hours saved per team per week came from automating the assembly work, not from removing human judgment from the loop entirely.
One more thing that gets underestimated: escalation paths. Automation is good at flagging that a threshold was crossed. It is not good at deciding whether that threshold crossing is a crisis or a blip. Define in advance what a Red status triggers: who gets called, what the response SLA is, and who owns the decision. Without that, an automated Red report just creates inbox anxiety.
Pro Tip: If your team has been running automated reports for more than a month, block one hour per week on the calendar specifically to read the reports as a stakeholder would. It is easy to stop reading your own automation. That hour is how you catch drift before your sponsor does.
EasyFlow runs these automations without the integration overhead
Most of the patterns in this article require connecting multiple tools, writing custom API calls, and maintaining a distribution layer. EasyFlow handles that execution layer out of the box.
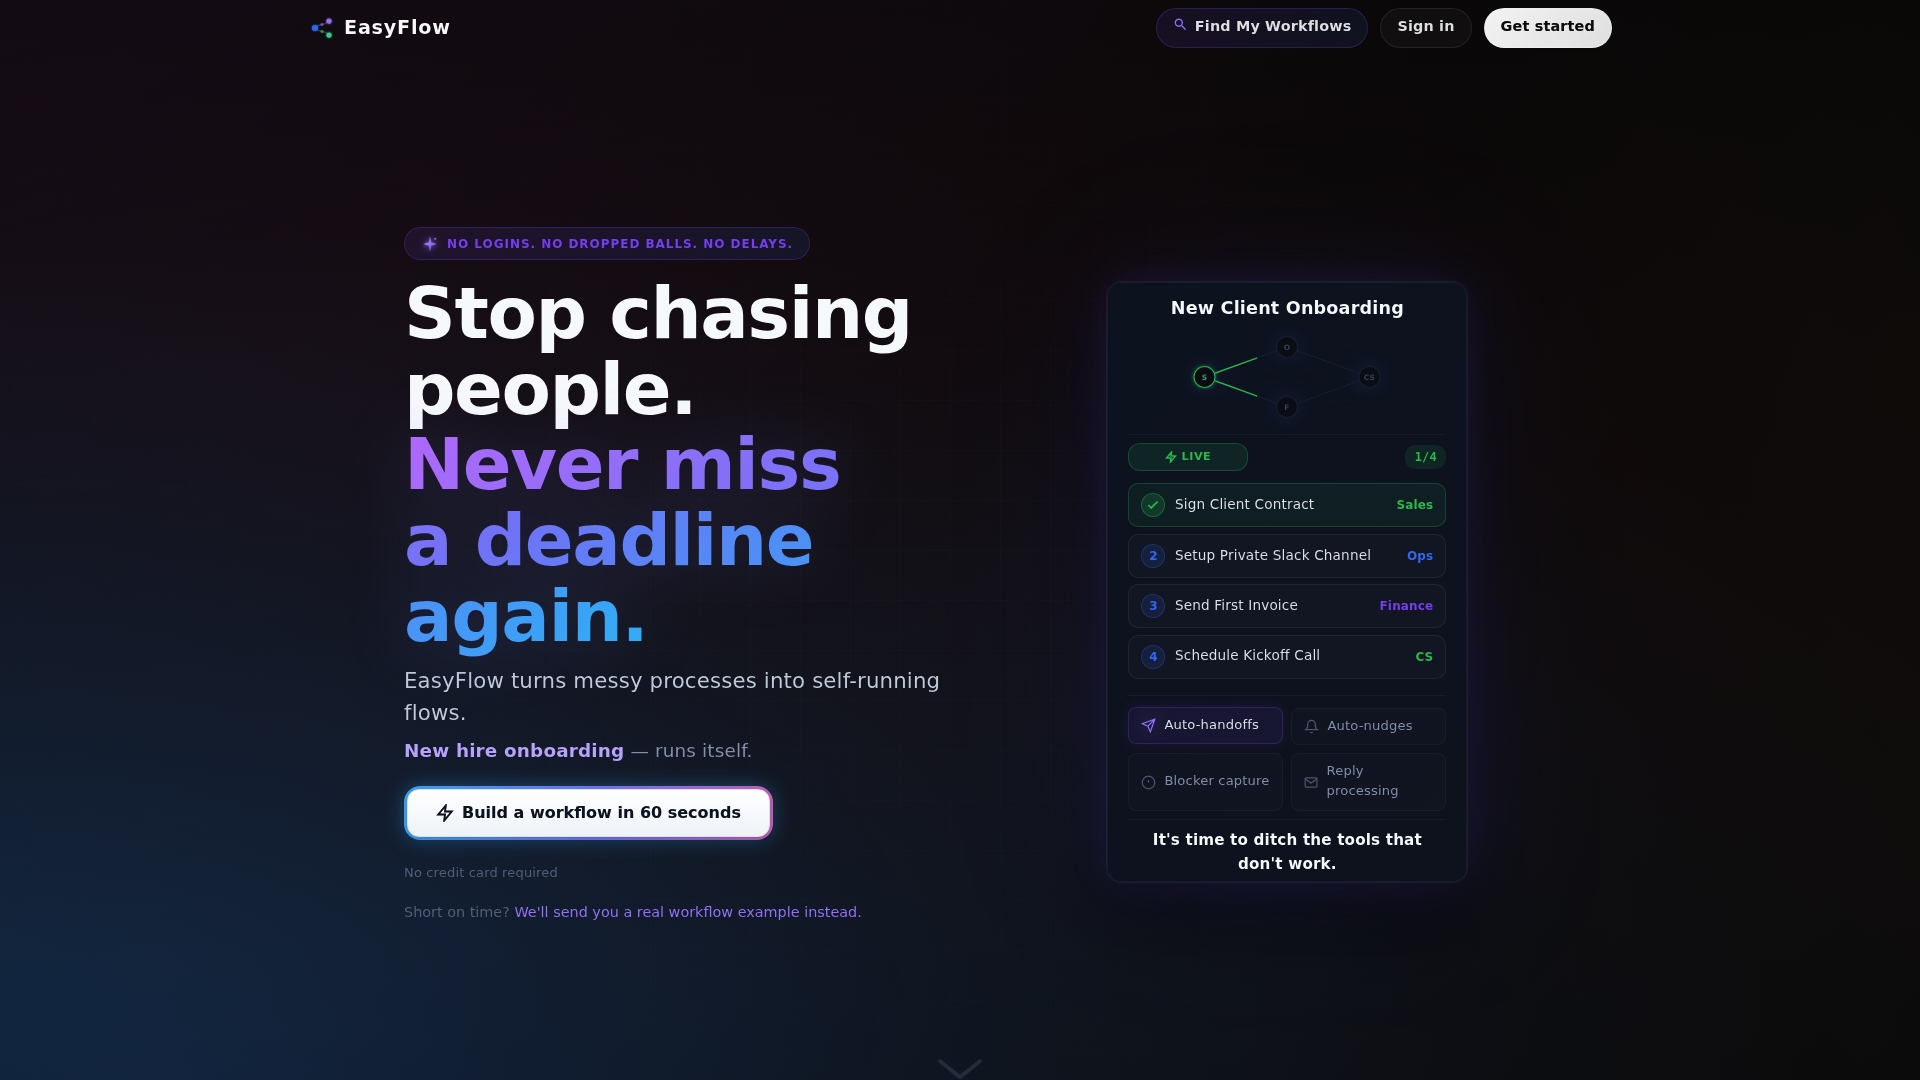
With EasyFlow, you can connect your existing PM data sources, configure scheduled runs or webhook triggers, and route formatted status updates to email, Slack, or a shared dashboard, without requiring every stakeholder to create an account. External collaborators (clients, contractors, approvers) receive magic links that let them complete actions or submit approvals directly, which closes the loop on the “decisions needed” field in your status reports automatically. Pre-built workflow templates cover the weekly executive summary and client update patterns described in this article, so your first automated report can go out within a day of setup rather than a week of integration work.
The team alignment guide on the EasyFlow blog covers the broader adoption strategy if you are rolling this out across multiple project teams.
Start with the weekly executive summary template and run it in draft mode for two weeks. When the outputs look right, flip it to auto-send. Teameasyflow and have your first automated status report running before your next Friday standup.
Sources
These are the most directly useful references for implementing the patterns covered in this article.
- Pulse of the Profession (PMI)
- Automated Project Status Report Generator (GitHub repo)
- TPM secret weapon: How we automated project updates with AI (Cedar blog)
- How to Automate Project Status Reporting in Slack (triggerAll)
- Put stakeholder updates on autopilot: The complete setup guide (falkster)
FAQ
What should a project status update always include?
Every status update needs a project name, reporting period, RAG health status, progress vs. plan, milestone status, top risks with owners, and next steps. These fields give stakeholders everything they need to make a decision without a follow-up meeting.
What are good examples of automated project status updates?
The four most common examples are the weekly executive summary (RAG status plus 250-word narrative, emailed Friday), the daily standup pre-brief (completed tasks and blockers posted to Slack each morning), the client status report (milestone progress in plain language, sent bi-weekly), and the portfolio health digest (RAG rollup across all projects, posted to a PMO dashboard weekly).
What makes a project status update genuinely useful?
Specificity and consistency. A useful update names the actual blocker, the owner, and the resolution deadline, not just “some delays.” Automated reports improve consistency because every stakeholder sees the same data from the same source at the same time.
How do you automate project status updates without breaking existing workflows?
Start by automating one report that already exists manually, using your current PM tool as the data source. The goal is to remove the assembly work, not change what gets reported. Running in draft mode for 2–3 weeks before enabling auto-send keeps the existing review process intact while you validate the output.
How much time can automating status reports actually save?
A documented AI-assisted workflow reported projected savings of 6–8 hours per team per week by automating Slack summarization, RAG extraction, and Jira updates. Results vary by team size and report volume, but even a single automated weekly report typically saves 1–2 hours of assembly time per cycle.