
Onboarding Bottlenecks Are Quietly Driving Your Churn

Onboarding bottlenecks increase churn because they delay the moment a customer sees real value, and every extra day without that “aha” moment weakens the habit that would otherwise keep them paying. This is not a theory. In self-serve SaaS, 40 to 60% of churn happens in the first 30 days, and most of that early loss traces back to activation failure rather than product quality.
If you manage customer success, product, or operations, three numbers tell you most of what you need to know:
- Time-to-first-value (TTFV): how long it takes a new customer to reach a defined “aha” moment
- Activation rate: the share of signups who complete that milestone, usually measured by Day 14
- Day-7/Day-30 retention: whether early users are still logging in and using core features
A quick diagnostic: if more than 30% of new accounts drop off before day 14, or your activation rate sits below 40%, you have an onboarding problem, not a marketing or pricing problem.
Table of Contents
- Why Onboarding Bottlenecks Increase Churn: The Behavioral Pathway
- The Data Behind Onboarding Failure and Early Churn
- Where Onboarding Actually Breaks Down
- How to Detect Onboarding-Driven Churn Before It Shows Up in Revenue
- Fixing the Bottleneck: A Prioritized Playbook
- How Automation Removes the Handoff Bottleneck
- Keeping the Bottleneck From Coming Back
- What EasyFlow Can Do for Your Onboarding Pipeline
- The Playbook in Practice
- Why the Standard Onboarding Advice Falls Short
- Sources
- FAQ
Why Onboarding Bottlenecks Increase Churn: The Behavioral Pathway
Churn rarely starts with a canceled subscription. It starts with a stalled Tuesday afternoon when a new user hits a locked feature, an empty dashboard, or a support ticket that goes unanswered for two days. That stall is the actual event. The cancellation, weeks later, is just the paperwork.
Activation is the specific point where a customer experiences the outcome they bought the product for, not just the point where they finish a setup checklist. A project management tool’s activation moment might be a team completing its first shared task. A payments platform’s might be the first successful transaction. Time-to-first-value measures how many minutes, hours, or days stand between signup and that moment. For simple, self-serve products, the useful target is under 15 minutes; for complex, high-touch products, under 48 hours.
Here’s what most teams miss: habits form in a narrow window. Once a customer goes 10 or 14 days without touching the product, the mental hook that got them to sign up in the first place starts to fade. They stop checking in daily. Then weekly. By the time a renewal notice or invoice hits their inbox, the account already feels disposable.
Checklist completion is not the same thing as readiness. A user who clicks through five onboarding steps and never touches the actual workflow has completed nothing that matters. Real onboarding measures whether someone can independently produce the outcome they came for, not whether they clicked “Next” enough times.
Pro Tip: Track “time to first meaningful action,” not “time to profile completion.” Profile completion measures compliance. First meaningful action measures whether the customer is actually using the thing they paid for.
The Data Behind Onboarding Failure and Early Churn
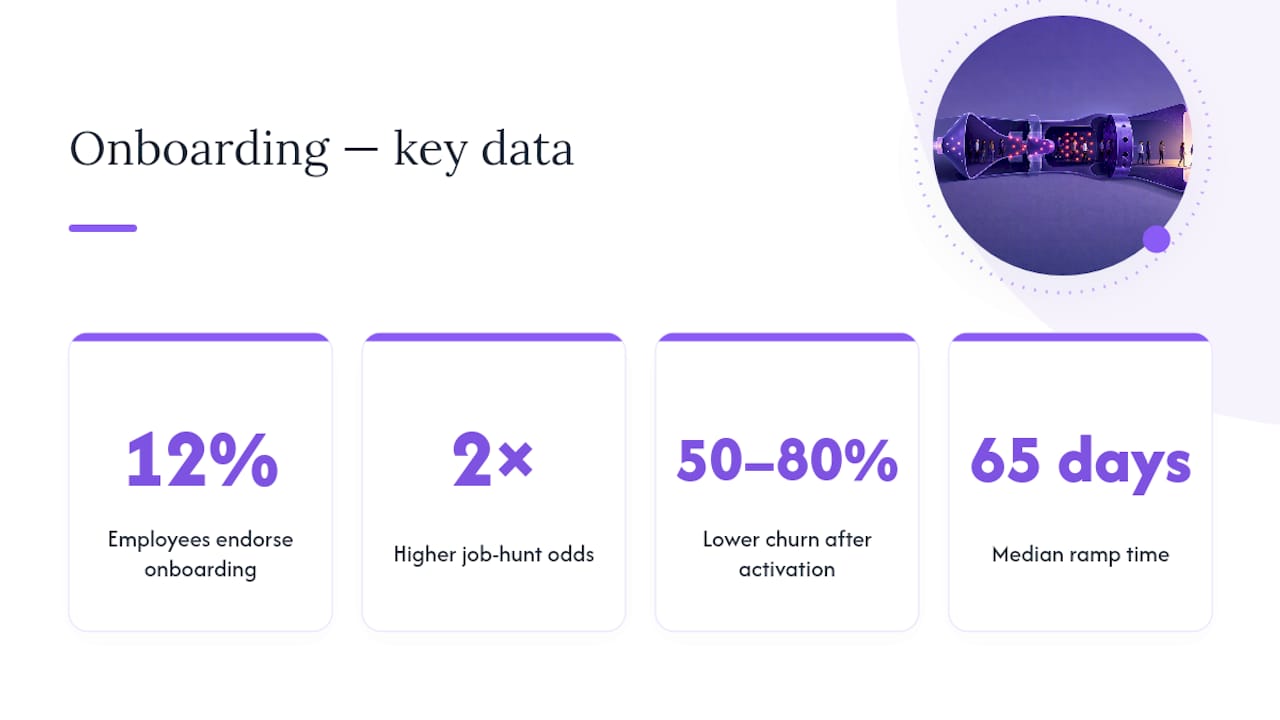
The link between onboarding and retention shows up everywhere researchers look. Only 12% of employees strongly agree their organization does a great job onboarding, according to Gallup, and poor onboarding roughly doubles the odds a new hire starts job-hunting within 90 days. The same dynamic plays out with customers: an unclear or slow start doesn’t just annoy people, it actively pushes them toward the exit.
The upside case is just as sharp. Customers who cross a defined activation milestone are 50 to 80% less likely to churn than those who never get there. That’s not a marginal lift. It’s the difference between a business that retains and one that leaks revenue out the bottom of the funnel every single month.
Six metrics consistently predict which accounts will stick:
These are the six leading indicators used across onboarding-to-retention playbooks, and they matter because they’re leading, not lagging. A churn report tells you what already happened. These numbers tell you what’s about to happen, while there’s still time to intervene. On the workforce side, median time-to-productivity runs around 65 days, which is why the most durable programs, whether for new hires or new customers, plan for a 90-day arc instead of a one-week sprint.
Where Onboarding Actually Breaks Down
Most bottlenecks fall into five repeatable patterns. Map your own funnel against these before you assume the problem is unique to your product.
- Access and provisioning delays. A shocking 43% of remote new hires wait more than a week for basic tools to get set up. The customer equivalent is a login that doesn’t work, an API key that takes three support tickets to generate, or a permission set that blocks the first real task.
- Handoff ambiguity between sales, CS, and ops. When a deal closes, who owns the next 14 days? If the answer is “everyone” or “it depends,” the account sits in limbo while three teams assume someone else has it.
- Empty states that hide value. A blank dashboard tells a new user nothing. Pre-populated sample data, templates, or a guided first task shows them what “good” looks like before they’ve built anything themselves.
- Checklist overload. Twelve onboarding steps where three would do. Every irrelevant step is a chance for someone to close the tab and never come back.
- Manager or champion absence. Manager involvement is the single largest predictor of onboarding success in workforce research, and the same holds for customer champions. When the internal advocate who pushed for the purchase goes quiet during setup, momentum dies with them.
Pro Tip: Audit your onboarding flow by asking one question at each step: “Does this step get the customer closer to their outcome, or closer to our internal paperwork?” Cut anything that only serves the second answer.
How to Detect Onboarding-Driven Churn Before It Shows Up in Revenue
You don’t need a data science team to catch this early. You need a clean event funnel and a habit of checking it weekly.
Start with the events that actually matter: account created, first login, first core action completed, activation milestone reached, and each subsequent session for the first 30 days. Everything else is noise.
Then run cohort checks at four windows: Day 1 (did they even log in twice?), Day 7 (have they touched a core feature?), Day 14 (activation deadline for most products), and Day 30 (are they forming a habit or fading out?). A step-by-step drop-off analysis that ranks losses by absolute user count, not percentage, tells you which single fix would save the most revenue.
Set alert thresholds so problems surface automatically:
- Activation under 40% by Day 7 triggers a review of that cohort’s onboarding path
- Day-7 login frequency under 3 sessions flags an account for CS outreach
- Support tickets clustering around the same onboarding step in week one signal a structural flaw, not a one-off complaint
- Early cancellation feedback mentioning “confusing,” “couldn’t figure out,” or “no one helped” gets tagged and reviewed monthly
Qualitative signals matter as much as the numbers here. If five customers in one week cancel and mention the same sticking point, you don’t need a bigger sample size to act.
Fixing the Bottleneck: A Prioritized Playbook
Not every fix deserves the same urgency. Run this roughly in order.
- Cut the welcome sequence down to one CTA. A single, specific next step outperforms multi-message orientation sequences for driving activation. Replace the five-email welcome series with one email that says exactly what to do next.
- Fill empty states with sample content. A pre-loaded template or demo dataset shows new users the payoff before they’ve invested any effort of their own.
- Automate provisioning. Access delays are almost always a systems problem, not a people problem. Automated account setup, permission assignment, and tool handoffs remove the week-long wait that kills momentum before it starts.
- Use magic links for external collaborators. Anyone who has to create an account just to complete one step in someone else’s process will stall. Passwordless, one-click access removes that friction entirely.
- Build behavior-triggered fallback branches. If a user hasn’t completed step two within 48 hours, trigger a different path: a nudge email, a task reassignment, or a CS alert, instead of letting the account sit untouched.
- Add manager or champion checkpoints at Day 7, 30, and 90. These aren’t status meetings. They’re structured check-ins that catch stalled accounts before renewal season does it for you.
- Re-trigger onboarding when the champion changes. If the person who bought your product leaves or changes roles, the new stakeholder needs a fresh, guided path, not silence.
- Segment touch levels by ARPA and ICP. High-value accounts justify white-glove onboarding. Lower-tier accounts need scalable automation. The costly mistake is treating a mid-tier account like either extreme: too much manual touch wastes CS capacity, too little leaves a hybrid segment quietly churning by Month 2 or 3 with no one noticing until the invoice bounces.
Pro Tip: Rank your fixes by absolute users lost at each funnel step, not percentage drop-off. A 10% drop at a step with 1,000 users costs you more than a 40% drop at a step with 50 users, even though the second number looks scarier on a dashboard.
How Automation Removes the Handoff Bottleneck
The most common bottleneck isn’t a bad email or a confusing dashboard. It’s the handoff itself: sales tells CS the deal closed, CS tells ops to provision access, ops waits on IT, and somewhere in that chain a customer is sitting with an unusable login for four days.

EasyFlow was built around that exact failure point. Instead of tracking a task and hoping someone follows up, it executes the process: sending automated reminders, flagging blockers the moment they appear, and routing work between teams without anyone needing to open a new tool.
Magic links let external collaborators complete their piece of an onboarding workflow without creating an account first, which matters most in exactly the scenarios described above: client implementations, vendor handoffs, and new-hire onboarding where an outside party needs to act quickly.
Teams piloting this kind of automation typically watch for a few outcome signals:
- Faster provisioning, measured in hours instead of days
- Higher Day-14 activation because fewer accounts stall waiting on someone else
- Fewer manual follow-ups from CS chasing the same handoff twice
Removing manual handoffs and letting external contributors act through a single link, rather than a login, is one concrete way automation shrinks the exact gap between “signed the contract” and “using the product” that early churn tends to hide inside.
This is one illustrative path, not the only one. Some teams solve the same problem with tighter internal SLAs and better cross-team communication. The mechanics matter less than the outcome: shrinking the distance between “signed up” and “got value.”
Keeping the Bottleneck From Coming Back
A fixed bottleneck that goes unmonitored has a way of quietly reappearing six months later, usually right after a team reorg or a product launch that nobody stress-tested against the onboarding flow.
Lock in the gains with a few structural habits:
- Set a service-level agreement for every onboarding milestone (provisioning within 24 hours, first CS check-in within 48) and name one accountable owner per milestone
- Put activation rate, TTFV, and Day-30 health score on the same weekly dashboard your team already checks, not a separate report nobody opens
- Run a drop-off audit every quarter, even when metrics look healthy, because treating onboarding as productized, measured work rather than one-time setup is what keeps it from decaying
- Collect structured feedback at 30, 60, and 90 days, not just at cancellation, when it’s too late to act
- Train managers and CS leads on structured 30/60/90 check-in conversations rather than informal “just checking in” messages that rarely surface real blockers
What EasyFlow Can Do for Your Onboarding Pipeline
Most onboarding bottlenecks come down to one thing: too many manual handoffs between people who each own a small piece of the process and none of the outcome. EasyFlow was built to close that gap by executing the workflow itself rather than just tracking whether someone remembered to do their part.
If you’re seeing the warning signs covered above, slow activation, stalled handoffs, external partners bouncing off login screens, it’s worth testing whether automation removes the friction faster than another round of internal process documentation would. You can read more on how client-facing teams reduce onboarding friction or start a trial directly to see how magic links and automated blocker detection apply to your own onboarding flow.
The Playbook in Practice
Onboarding bottlenecks increase churn because delayed value erodes the habit loop that turns a signup into a retained customer, and that erosion is measurable well before a cancellation ever happens.
| Point | Details |
|---|---|
| Watch the leading indicators | Track TTFV, Day-14 activation, and Day-30 health score weekly, not just churn after the fact. |
| Treat activation as the real milestone | Checklist completion isn’t readiness; measure whether customers can independently reach their outcome. |
| Fix handoffs first | Provisioning delays and unclear ownership between sales, CS, and ops cause the most avoidable early churn. |
| Prioritize by absolute loss | Rank fixes by how many users a step loses, not the percentage drop-off, to protect the most revenue. |
| Lock in gains with governance | SLAs, weekly dashboards, and 30/60/90 check-ins keep fixed bottlenecks from quietly returning. |
Why the Standard Onboarding Advice Falls Short
Most onboarding advice treats the problem as a content issue: better emails, a slicker welcome screen, a shorter checklist. That’s not wrong, exactly, but it misses where the real damage happens. The damage happens in the handoffs nobody owns, the access request stuck in someone’s inbox, the champion who goes quiet after the contract is signed.
The data backs this up more than the conventional wisdom admits. Activation, not satisfaction scores, predicts retention. A customer who reaches real value early is far less likely to churn, while a customer who merely feels good about a polished welcome sequence but never touches the product is churning in slow motion.
If you take one thing from this, prioritize instrumentation before redesign. Know exactly where your funnel breaks and how many users each break point costs you. Then fix the handoff bottlenecks, provisioning, ownership, external access, before you touch the copywriting. Automation earns its place here because it removes the exact friction that manual handoffs can’t scale past. But automation without measurement is just a faster way to run a broken process.
— Harsh
Sources
- Poor onboarding experience: Why It Drives Churn and How to Fix It - RetentionCheck
- Onboarding to Reduce Churn: 7 Data-Backed Plays for 2026 | ChurnDefense
- Why onboarding experience is key to retention | Gallup
- Onboarding Cost 2026: $4,100 per New Hire | Stealth Agents
FAQ
What are common problems during customer onboarding?
The most frequent issues are provisioning delays, unclear ownership between teams, empty states that hide product value, overloaded checklists, and a lack of manager or champion engagement during the first weeks.
How does onboarding affect customer retention?
Onboarding determines whether a customer reaches the activation milestone that predicts loyalty; customers who activate are 50 to 80% less likely to churn than those who never do.
How can teams reduce churn and increase retention?
Focus on shrinking time-to-first-value, automating handoffs and provisioning, and instrumenting activation metrics so drop-off gets caught and fixed within the first 30 days rather than discovered at renewal.
What percentage of churn happens early in the customer lifecycle?
Between 40 and 60% of churn in self-serve SaaS happens within the first 30 days, largely tied to activation failure rather than product dissatisfaction.
What is time-to-first-value and why does it matter?
Time-to-first-value is how long it takes a new customer to reach the outcome they signed up for; shorter TTFV correlates directly with higher activation rates and lower early churn.