
Process Diagram UML: Build Workflows That Actually Run

In this guide, “process diagram UML” means an executable business process diagram — a visual map designed to run inside workflow automation software, not a software-design artifact for developers. Pick one painful, repeatable process your team handles manually, map its happy path plus its two or three most common exceptions, and you have the raw material for automation. EasyFlow can convert that diagram into a running workflow without requiring your team or external collaborators to create accounts.
Key Takeaways
Executable process diagrams work when they are built with operators, grounded in BPMN semantics, tested before deployment, and connected to measurable KPIs from day one.
| Point | Details |
|---|---|
| Pick one process first | Scope a single trigger-to-outcome process before attempting to automate multiple workflows. |
| Map before automating | Document the current process, fix broken steps, then build the diagram as the automation specification. |
| Use BPMN semantics | BPMN (ISO/IEC 19510) gives diagrams the precision needed for execution engines and cross-team clarity. |
| Instrument KPIs from the start | Tag cycle time, exception rate, and automation rate in the diagram before go-live so you can measure ROI. |
| EasyFlow runs the diagram | EasyFlow’s execution engine, magic links, and monitoring turn a finished diagram into a live workflow. |
Table of Contents
- What is an executable process diagram for operations?
- What core elements does your process diagram need?
- How do you design an executable diagram step by step?
- How do diagram elements map to automation and integrations?
- What templates cover the most common operations use cases?
- How do you validate, test, and monitor a live diagram?
- What timeline and costs should you budget for?
- Why EasyFlow works well for ops teams building executable diagrams
- The pilot-first approach is the only one worth taking
- Run your first executable diagram in EasyFlow
- Sources
- FAQ
What is an executable process diagram for operations?
An executable process diagram shows every trigger, task, decision, timer, owner, and data object a workflow engine needs to run a process without human intervention on the routine steps. That is the key difference from a static flowchart: a static chart documents; an executable diagram specifies.
The business case is direct. Visible ownership cuts handoff errors. Explicit timers and SLAs reduce cycle time. Documented exception paths mean fewer one-off escalations clogging your inbox. And because the diagram is the specification, automation ROI arrives faster — engineers implement what the diagram already decided.
For notation, BPMN (Business Process Model and Notation) is the right baseline. Standardized as ISO/IEC 19510 by the Object Management Group, it gives you a graphical language readable by business stakeholders and precise enough for technical implementation. When process modeling needs to support automation or cross-team clarity, BPMN is the standard practitioners reach for.
What core elements does your process diagram need?
Every executable diagram requires a fixed set of primitives. Miss one and the automation engine either guesses or fails.
- Start and end events: mark the trigger (a form submission, an API call, a scheduled timer) and every terminal state (success, failure, cancellation).
- Tasks and activities: label each with a verb plus owner convention — “Review contract / Legal” rather than just “Review.”
- Gateways and decisions: exclusive gateways for either/or branches; parallel gateways for concurrent tasks that must sync before continuing.
- Sequence and message flows: sequence flows connect internal steps; message flows handle communication with external parties (vendors, clients, contractors).
- Timers and escalation events: attach a timer to any step with an SLA so the engine can fire a reminder or escalate automatically.
- Error and compensation events: define what happens when a step fails — retry, notify, or route to a human exception handler.
- Data objects and pools/lanes: data objects carry the fields each task reads or writes; pools and lanes assign ownership to teams or systems.
Research on business process visualizations confirms that semantic icons, graphical annotations, and explicit data dimensions improve comprehension for both business and technical stakeholders. A small lock icon on a task signals a compliance check; a clock icon signals a timer. These additions cost seconds to add and save minutes of explanation in every review meeting.
Pro Tip: Keep two versions of the same diagram: an executive map with major steps and owners only, and an operator map that includes exception routes, wait states, and rework loops. Workflow visualization research recommends this two-view approach so diagrams stay readable without hiding operational truth.
BPMN 2.0’s XML interchange format also means you can move a precisely modeled diagram between tools and, when the engine supports it, execute it directly — a practical reason to model with standard notation from day one.
How do you design an executable diagram step by step?
Follow this sequence. Skipping steps, especially discovery, is the single most common reason diagrams fail in production.
- Scope the process. Define the start trigger, the end state, and what counts as success or failure. Limit the first pilot to one process.
- Run a discovery session. Interview the operators who actually do the work. Document exceptions, rework loops, exact data fields, and message formats. Map the current process before touching automation — a clean map reveals which steps are manual, rules-based, or automation candidates.
- Model the happy path first. Draw the straight-line scenario from trigger to success. Add pools and lanes for ownership. Name every task with a verb plus owner.
- Layer in exceptions. Add gateways for decisions, error events for failures, and timer events for SLAs. Keep exception paths visually distinct from the happy path.
- Validate with operators and engineers. Walk the diagram live. Confirm SLA values, retry rules, and data contracts. Fix ambiguities before writing a line of integration code.
- Version and govern. Store the approved model with a version number, owner name, and a one-line hypothesis about the operational gain you expect. Changes require a new version, not an overwrite.
How do diagram elements map to automation and integrations?
Each diagram primitive maps to a concrete automation behavior:
A start event becomes a trigger — an inbound API call, an email received, a scheduled cron, or a form submission. A task becomes either an automated action (an API call, a data transformation, a notification) or a human task routed to a specific owner. A gateway becomes conditional routing logic or a parallel execution fork. A timer event fires a reminder, an escalation, or a timeout branch.
For external collaborators, message flows map to magic links: a one-time URL sent by email that lets a vendor, client, or contractor complete a task without creating an account. This is where workflow mapping pays off — the diagram already specified who receives the link and what data they submit.

Your integration checklist before deployment: confirm system endpoints and authentication methods, define idempotency rules so retried calls do not duplicate records, document data contracts (field names, types, required vs. optional), and specify error-handling expectations for each external system.
Operational controls to build in: retry counts and backoff intervals for transient failures, dead-letter handling for tasks that exhaust retries, escalation paths that route to a human when automation cannot resolve, and full audit logging for every state transition. Annotating diagrams with live status and KPIs turns the diagram from documentation into operational infrastructure.
What templates cover the most common operations use cases?
- New hire onboarding: Trigger: offer accepted. Key fields: start date, role, equipment list, system access required. Owners: HR, IT, hiring manager. SLA: all access provisioned by day 1. Exceptions: late equipment, missing system credentials. KPIs: cycle time from offer to day-1 ready, exception rate.
- Purchase approval: Trigger: purchase request submitted. Key fields: amount, vendor, cost center, justification. Owners: requester, finance, approver. SLA: approval within 48 hours. Exceptions: amount exceeds threshold (escalate), missing PO number. KPIs: approval cycle time, auto-approval rate.
- Client implementation kickoff: Trigger: contract signed. Key fields: client name, go-live date, integration requirements, assigned CSM. Owners: sales, CSM, engineering. SLA: kickoff call within 5 business days. Exceptions: missing technical contacts, delayed data migration. KPIs: time to first value, exception rate.
- Incident response: Trigger: alert fired or ticket created. Key fields: severity, affected system, on-call owner. Owners: on-call engineer, incident commander. SLA: P1 acknowledged within 15 minutes. Exceptions: on-call unavailable (escalate), unresolved after 2 hours. KPIs: mean time to acknowledge, mean time to recovery.
- Marketing campaign launch: Trigger: campaign brief approved. Key fields: launch date, channels, budget, creative assets. Owners: marketing manager, design, paid media. SLA: assets ready 5 days before launch. Exceptions: creative rejected, budget not approved. KPIs: on-time launch rate, steps automated.
How do you validate, test, and monitor a live diagram?
Run a dry run before any real data touches the process. Replay logged events from a prior manual run through the diagram and confirm every branch routes correctly. Then do a staged rollout with a small sample of real cases, with operators watching the run log in real time.
| Metric | What to watch | Anomaly signal |
|---|---|---|
| Cycle time | End-to-end time per case | Rising trend signals a bottleneck task |
| Queue length | Tasks waiting for a human | Spike signals under-resourcing or a blocked step |
| Failed tasks | Tasks that hit error state | Any non-zero rate needs a root cause review |
| Mean time to recovery | Time from failure to resolution | High MTTR signals missing escalation paths |
Acceptance criteria belong in writing before you go live: agree with operators on the maximum acceptable cycle time, the maximum failed-task rate, and the minimum automation rate for the happy path.
For rollback: keep the previous model version active in a staging environment. If a live incident requires a pause, stop new case creation at the trigger, let in-flight cases complete, then swap to the prior version. Never overwrite a live model mid-execution.
What timeline and costs should you budget for?
| Phase | Typical duration | Primary cost driver |
|---|---|---|
| Discovery | 1–2 weeks | Internal FTE time (operators + analyst) |
| Modeling and review | 1–3 weeks | Analyst or ops lead time, stakeholder reviews |
| Integration and testing | 2–4 weeks | Engineering time, API complexity |
| Staged rollout | 1–2 weeks | QA, operator training, monitoring setup |
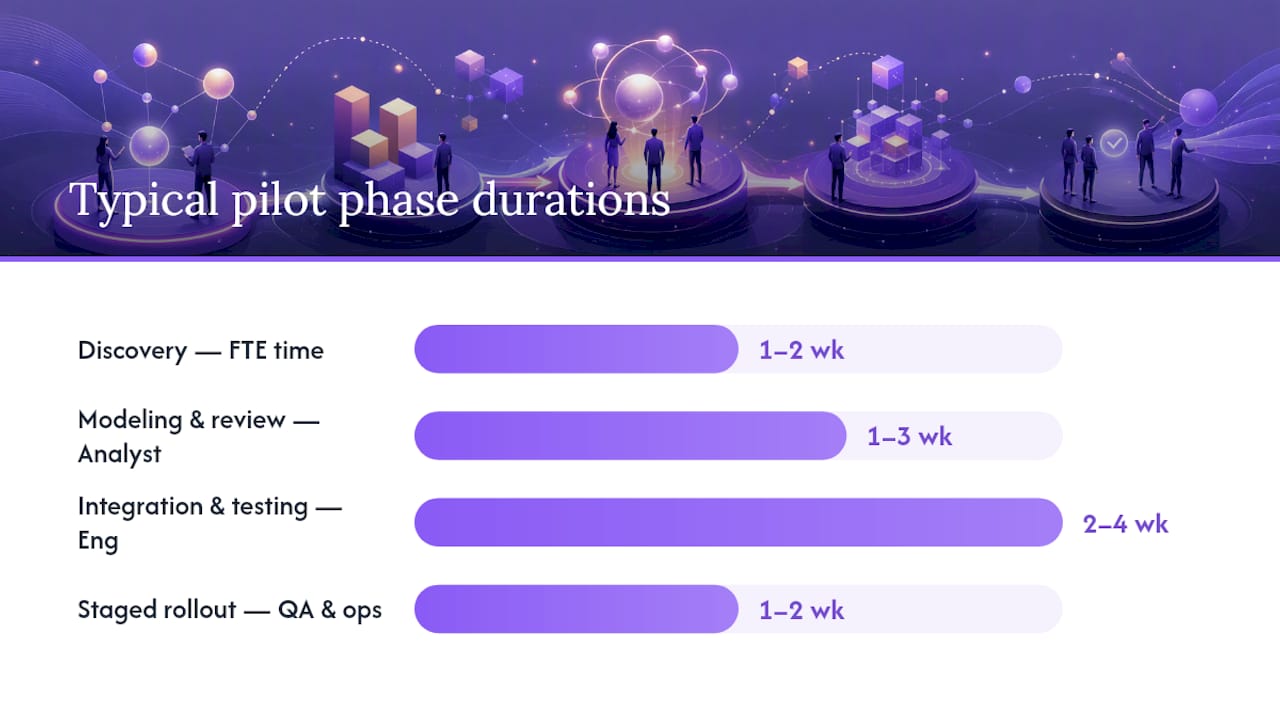
The biggest variable is integration complexity. An API-first system with documented endpoints cuts integration time sharply compared to a legacy system requiring custom connectors or manual data entry bridges. License costs depend on the subscription tier you choose; most platforms offer a free tier or trial that covers a pilot.
The pilot recommendation: build a minimum viable diagram that automates the high-volume happy path and preserves human checks at exception points. Map and fix the process first, then automate. A diagram that automates a broken process just breaks faster.
Why EasyFlow works well for ops teams building executable diagrams
EasyFlow is built for the use cases this guide covers, not for software engineers modeling system behavior.
- No-code diagram editor: draw or import your process diagram without writing configuration files.
- Execution engine: the diagram runs directly — tasks are assigned, reminders fire, and handoffs happen automatically.
- Magic links for external collaborators: vendors, clients, and contractors complete tasks via a one-time link with no account required.
- Email and API integrations: connect existing systems without custom middleware for standard integrations.
- Simulation and dry runs: test the diagram against sample data before touching live cases.
- Monitoring and alerting: track cycle time, queue length, and failed tasks against the KPIs you tagged in the diagram.
- Versioning and governance: every model change creates a new version; ownership fields and approval records stay attached.
Operations teams using EasyFlow for new hire onboarding and client implementations report fewer manual follow-ups and faster handoff completion — the two metrics most directly tied to diagram quality and execution fidelity.
To get started: import your pilot diagram, run a simulated week of events, and invite one external collaborator via magic link to confirm the end-to-end flow works before you go live.
The pilot-first approach is the only one worth taking
Most operations teams that struggle with process automation share one pattern: they tried to automate too much, too fast, without a clean diagram. The diagram is not the deliverable — the running process is. But you cannot get to a running process without a diagram that is honest about exceptions, ownership, and data.
Pick one process. Map it with operators in the room, not from memory. Measure cycle time and exception rate before you start, run the pilot for two weeks, and measure again. That gap is your automation ROI, and it is the number that justifies the next process.
Run your first executable diagram in EasyFlow
Cut approval times and eliminate manual handoffs without rebuilding your stack. EasyFlow lets you draw the process diagram, attach owners and SLAs, and run the workflow the same day — external collaborators included, no accounts required on their end.
Import your pilot diagram, run a simulated week of events, and invite one external collaborator via magic link to confirm the flow end to end. The 14-day free trial gives you enough runway to measure a real before-and-after on cycle time and exception rate. Start at EasyFlow and run your first process this week.
Sources
- Business process visualisation effectiveness (arXiv)
- Business process modeling | TechTarget
- Workflow Visualization: Unlock Efficiency for 2026 - MakeAutomation
- Business Process Mapping: Templates and How-To (2026)
FAQ
What does “process diagram UML” mean for operations teams?
For operations teams, it means an executable business process diagram — a visual workflow map designed to run in automation software, specifying triggers, tasks, decisions, owners, and timers. It is not a software-design UML artifact.
When should you use BPMN instead of a simple flowchart?
Use BPMN when the process will be automated, involves multiple system integrations, or requires cross-team clarity on ownership and exception handling. A simple flowchart works for discovery and communication but lacks the precision an execution engine needs.
How long does it take to deploy a pilot executable diagram?
A typical pilot runs about 5 weeks: 1–2 weeks for discovery, 1–3 weeks for modeling and review, 2–4 weeks for integration and testing, and 1–2 weeks for staged rollout. Integration complexity is the biggest variable.
Can external collaborators participate without creating accounts?
Yes. EasyFlow sends external collaborators a magic link by email, letting them complete their assigned task without registering. This removes onboarding friction for vendors, clients, and contractors who appear in the diagram as message-flow participants.
What KPIs should you track after deploying an executable diagram?
Track cycle time (end-to-end per case), exception rate (cases that leave the happy path), failed-task rate, and automation rate (percentage of steps completed without human intervention). Measure these before and after deployment to quantify the operational gain.