
How Workflow Analytics Improve Decisions for Teams

Workflow analytics is the systematic analysis of operational process data to improve decision-making, efficiency, and business outcomes. The term sits under the broader discipline of Business Process Analytics, which turns raw event logs and SLA metrics into evidence that leaders can act on. Understanding how workflow analytics improve decisions is no longer optional for operations-heavy teams. The global data analytics market is projected to grow at a 28.7% CAGR from 2025 to 2030. That growth rate signals a fundamental shift: organizations that ignore workflow data are falling behind those that treat it as a core management input.
What benefits does workflow analytics provide for decision-making?
Workflow analytics gives leaders visibility they cannot get from status meetings or spreadsheets. When you can see exactly where work stalls, how long each step takes, and which handoffs fail most often, you stop managing by assumption. That shift from gut feel to evidence is the core benefit.
The numbers back this up. Organizations using Business Process Analytics achieved a 40% reduction in order-to-delivery time and $3.2 million in annual operational cost savings by improving workflow transparency. A 40% reduction in delivery time is not a marginal gain. It means faster customer fulfillment, fewer escalations, and a direct impact on revenue.
“Process mining reveals actual process flows from event logs, identifying where and why delays occur, leading to evidence-based optimization instead of guesswork.”
Process mining reconstructs what actually happened in your operations, not what your process map says should happen. That gap between the designed process and the real one is where most inefficiency hides.
The major benefits of workflow analytics for decision-making include:
- Cost reduction: Identifying redundant steps and unnecessary handoffs cuts labor and overhead costs.
- Speed: Pinpointing bottlenecks accelerates cycle times and improves on-time delivery rates.
- Quality: Detecting error-prone steps before they compound reduces rework and defect rates.
- Predictability: Tracking SLA compliance trends gives leaders early warning before breaches occur.
- Customer satisfaction: Faster, more consistent processes directly improve the experience customers receive.
Each of these benefits compounds. Faster processes cost less to run. Lower error rates reduce rework. Better SLA performance reduces churn. The advantages of workflow data are not isolated improvements. They reinforce each other.
How do workflow analytics support predictive and proactive decision-making?
Most teams operate reactively. A customer complains, a deadline slips, a queue backs up, and then someone investigates. Workflow analytics breaks that cycle by giving leaders leading indicators instead of lagging ones.
Predictive analytics in workflow supports three specific forecast types: remaining time predictions, next activity predictions, and outcome predictions. Remaining time predictions tell you whether a case will finish before its deadline. Next activity predictions flag which step is most likely to stall. Outcome predictions estimate whether a process instance will succeed or fail based on current signals. Together, these capabilities let you intervene before a problem becomes visible to the customer.
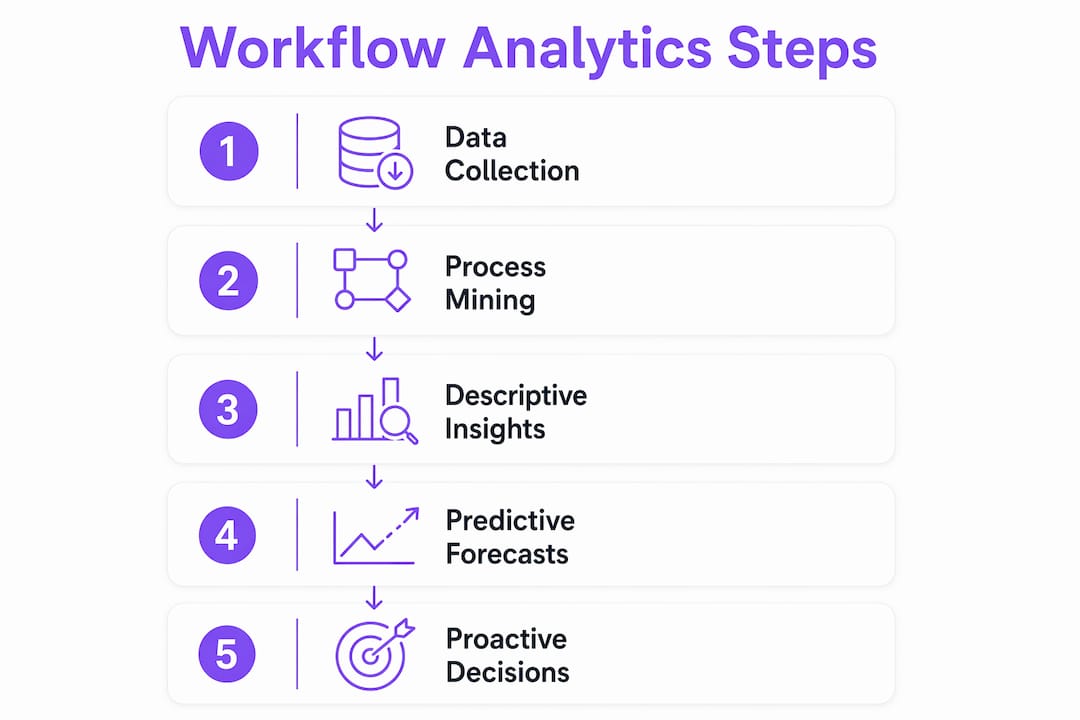
AI models integrated with workflow analytics detect abnormal queue growth, predict delays, classify issues, and recommend next actions. That is a fundamentally different posture than reviewing a report after the fact. Operations leaders who use these signals pivot from reactive firefighting to governed, continuous improvement.
Pro Tip: Predictive accuracy depends entirely on data quality. Before deploying any predictive model, audit your event logs for completeness, timestamp accuracy, and consistent case identifiers. A model trained on dirty data will generate confident wrong answers.
The practical shift looks like this:
- Reactive mode: A shipment is late. The team investigates, finds a bottleneck in the approval step, and escalates.
- Proactive mode: Analytics flags that approval queue depth has grown 40% above baseline. A team leader reassigns capacity before any shipment is affected.
Workflow analytics as leading indicators track SLA breach trends and capacity risks to enable early detection of process bottlenecks. That early detection window is where the real value of decision-making through workflow analysis lives.
What role do dashboards and decision-support systems play?
Raw analytics data does not make decisions. People do. The question is whether the data reaches decision-makers in a form they can interpret and trust. That is where dashboards and decision-support systems become critical.

A layered architecture combining process mining, dashboards, and decision-support systems enables workflow analytics to translate raw data into operational decisions effectively. Each layer serves a distinct function. Process mining extracts what actually happened. Dashboards organize that information visually. Decision-support logic applies rules or models to recommend a course of action.
| Analytics layer | Primary function | Decision value |
|---|---|---|
| Process mining | Reconstructs actual process flows from event logs | Reveals hidden inefficiencies and deviations |
| BI dashboards | Visualizes KPIs, SLA trends, and throughput metrics | Gives leaders a real-time operational picture |
| Decision-support systems | Applies rules and models to recommend actions | Reduces cognitive load and speeds up responses |
BI dashboards organize and visualize process mining data into usable insights, but managing information complexity and interpretation skills are vital to decision quality. A dashboard that shows 47 metrics simultaneously is not more useful than one showing five well-chosen ones. Clarity beats completeness every time.
Decision quality is the key mechanism through which analytics capabilities improve firm performance. That finding matters because it shifts the focus from the tool to the decision. The goal is not to have better dashboards. The goal is to make better calls, faster, with less uncertainty.
Pro Tip: When building dashboards for operational teams, start with three questions: What decision does this metric support? Who makes that decision? How often do they need to see it? If you cannot answer all three, the metric does not belong on the dashboard.
How can organizations implement workflow analytics effectively?
Implementation fails most often not because of technology, but because of process and governance gaps. Data silos, inconsistent definitions, and lack of coordination between teams undermine even the best analytics platforms.
Successful workflow analytics implementation follows a six-step framework: Discover, Prioritize, Design, Simulate, Implement, and Monitor. Each step builds on the last, and skipping any one of them creates problems downstream.
- Discover: Map your current processes using event log data. Identify where the real process diverges from the documented one.
- Prioritize: Rank processes by impact. Focus first on the workflows with the highest cost, volume, or customer exposure.
- Design: Redesign the target process based on what the data reveals, not what stakeholders assume.
- Simulate: Model the redesigned process before deploying it. Simulation catches unintended consequences without disrupting live operations.
- Implement: Deploy the new process with clear ownership, defined SLAs, and integrated data capture from day one.
- Monitor: Track performance continuously. Set thresholds that trigger alerts when metrics drift outside acceptable ranges.
Integrating data from ERP, MES, WMS, and CRM systems is not optional. Workflow analytics that draws from only one system gives you a partial picture. A manufacturing team that tracks production throughput but not supplier lead times will miss the upstream cause of most delivery failures.
Key success factors for teams adopting workflow analytics:
- Assign a process owner for every workflow you instrument.
- Standardize event log formats across systems before building any model.
- Build audit trails into every automated action so decisions can be reviewed and explained.
- Train managers to interpret analytics outputs, not just read them.
- Review and recalibrate models quarterly as process conditions change.
Understanding how workflow mapping supports operations is a practical first step before layering analytics on top. You cannot measure what you have not defined. Teams that skip the mapping step end up with analytics that measure the wrong things precisely.
Key Takeaways
Workflow analytics improves decisions by converting process data into leading indicators that let leaders act before problems escalate, not after.
| Point | Details |
|---|---|
| Concrete financial impact | Business Process Analytics delivered a 40% OTD reduction and $3.2 million in annual savings. |
| Predictive over reactive | Analytics supports remaining time, next activity, and outcome predictions to enable early intervention. |
| Decision quality is the goal | Analytics tools only create value when they improve the actual decisions leaders make. |
| Layered architecture matters | Process mining, dashboards, and decision-support systems each serve a distinct and necessary role. |
| Implementation requires governance | Data integration, audit trails, and manager training determine whether analytics delivers results. |
The gap between having data and using it well
Most teams I have worked with do not have a data shortage. They have a decision shortage. The dashboards exist. The reports run every Monday. But the meeting still starts with someone saying, “I think the bottleneck is in approvals.” That phrase, “I think,” is the tell. It means the data is not reaching the decision in time, in the right form, or with enough trust behind it.
The organizations that get real value from workflow analytics share one trait: they treat decision quality as a measurable output, not a soft skill. They ask, “Did this metric change the decision we made?” If the answer is no, they redesign the metric, not the process. That discipline is harder than buying a new analytics platform. It requires managers who are willing to be wrong in public and change course based on evidence.
The other pattern I have seen consistently is that workflow automation and analytics work best when they are built together, not bolted together. When the automation captures clean event data by design, the analytics layer has something reliable to work with. When analytics is added as an afterthought to a manual process, you spend most of your time cleaning data instead of reading it.
The teams that move fastest are the ones that instrument their workflows from the start, build feedback loops into every process, and give managers the training to act on what they see. The technology is the easy part.
— Harsh
How EasyFlow supports data-driven workflow decisions
Teams that want to apply workflow analytics need clean, consistent process data to start with. That requires workflows that actually execute, not just track tasks.
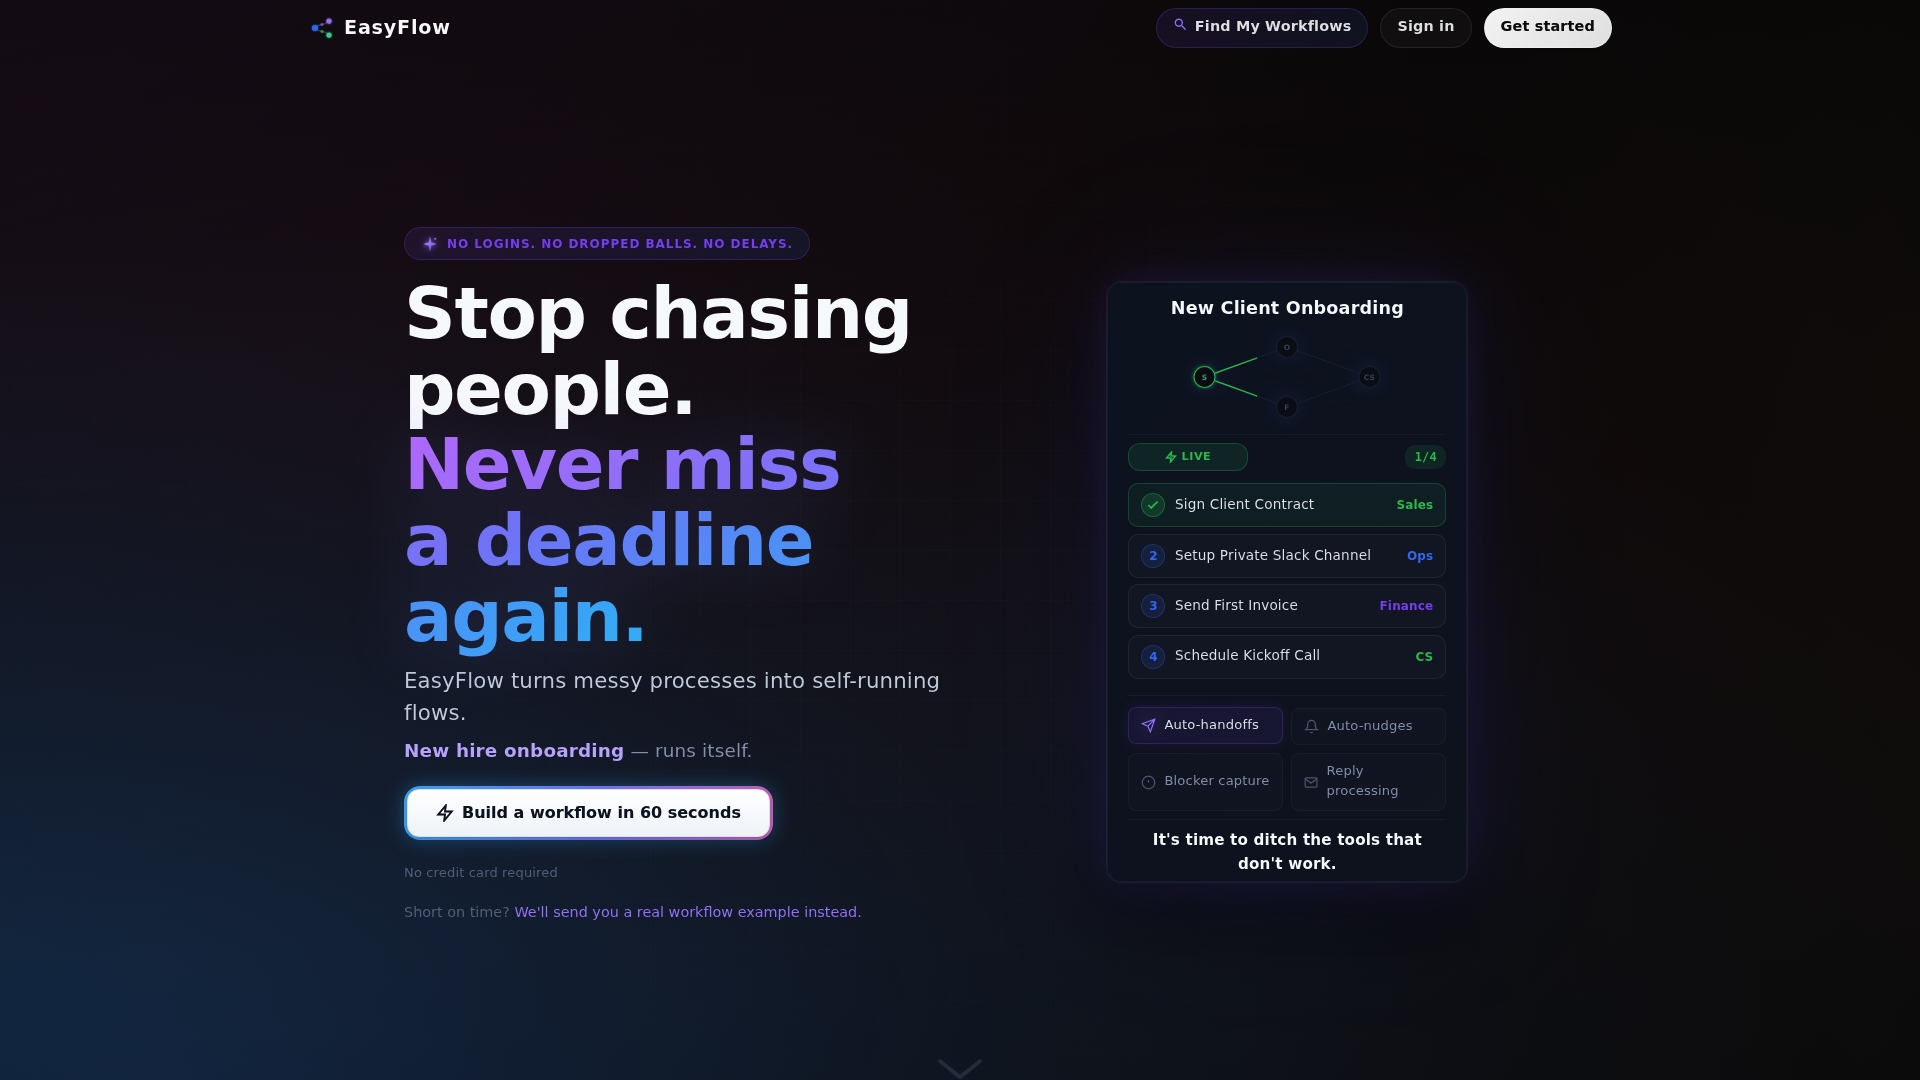
EasyFlow automates the workflows that typically generate the most operational noise: client onboarding, new hire setup, approval chains, and cross-team handoffs. Because EasyFlow executes processes rather than just listing them, every step generates reliable data on timing, completion, and handoff quality. External collaborators can participate via magic links without creating accounts, which means fewer gaps in your process data. Teams using EasyFlow get the operational visibility needed to make workflow analytics work in practice. Start with a free account and see where your process data actually leads.
FAQ
What is workflow analytics?
Workflow analytics is the systematic analysis of operational process data to identify inefficiencies, measure performance, and support better business decisions. It draws on techniques including process mining, SLA tracking, and predictive modeling.
How does workflow analytics improve decision-making?
Workflow analytics replaces assumption-based decisions with evidence from actual process behavior. Organizations using Business Process Analytics have achieved a 40% reduction in order-to-delivery time and $3.2 million in annual savings by acting on that evidence.
What is the difference between descriptive and predictive workflow analytics?
Descriptive analytics shows what happened in a process. Predictive analytics forecasts remaining time, next likely activity, and probable outcomes so teams can intervene before a problem reaches the customer.
Why do dashboards alone fail to improve decisions?
Dashboards visualize data but do not interpret it. Decision quality is the mechanism that connects analytics to firm performance, and that requires managers trained to act on what they see, not just read it.
How long does it take to implement workflow analytics?
Implementation timelines vary by process complexity and data readiness. The six-step framework of Discover, Prioritize, Design, Simulate, Implement, and Monitor provides a structured path, but teams with fragmented data sources typically need several weeks of data preparation before any model produces reliable outputs.